Williams R indicator
In the active world of forex trading, understanding technical indicators is crucial for informed decision-making. These tools provide traders with insights into market trends, potential entry and exit points, and overall momentum. Among these indicators, the Williams %R Indicator stands out for its simplicity and effectiveness in gauging overbought and oversold conditions in the market.
Developed by Larry Williams, a renowned trader and market analyst, the Williams %R, or Williams Percent Range Indicator, is a momentum-based tool. It measures the relationship between a specific closing price and the price range over a chosen period, presenting the result as a percentage. The indicator's value ranges from -100 to 0, with levels closer to -100 indicating oversold conditions and those closer to 0 signalling overbought conditions.
The Williams Indicator is particularly valued for its ability to identify potential market reversals, making it a favourite among traders aiming to capitalize on price fluctuations.
What is the Williams %R indicator?
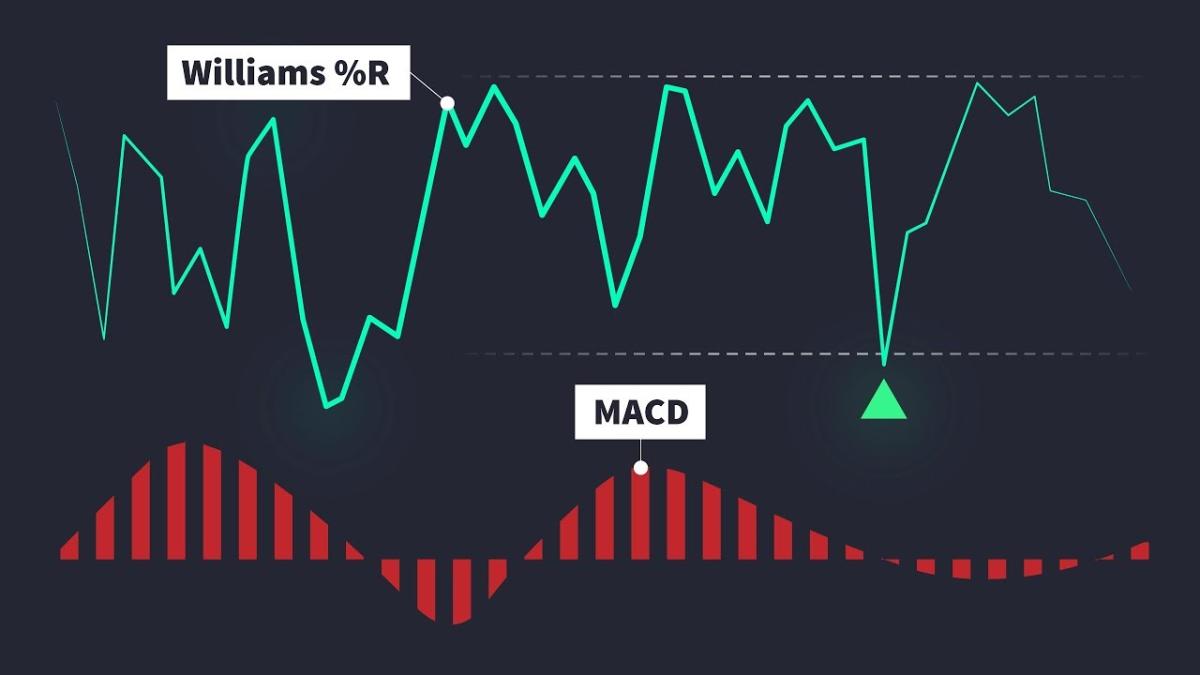
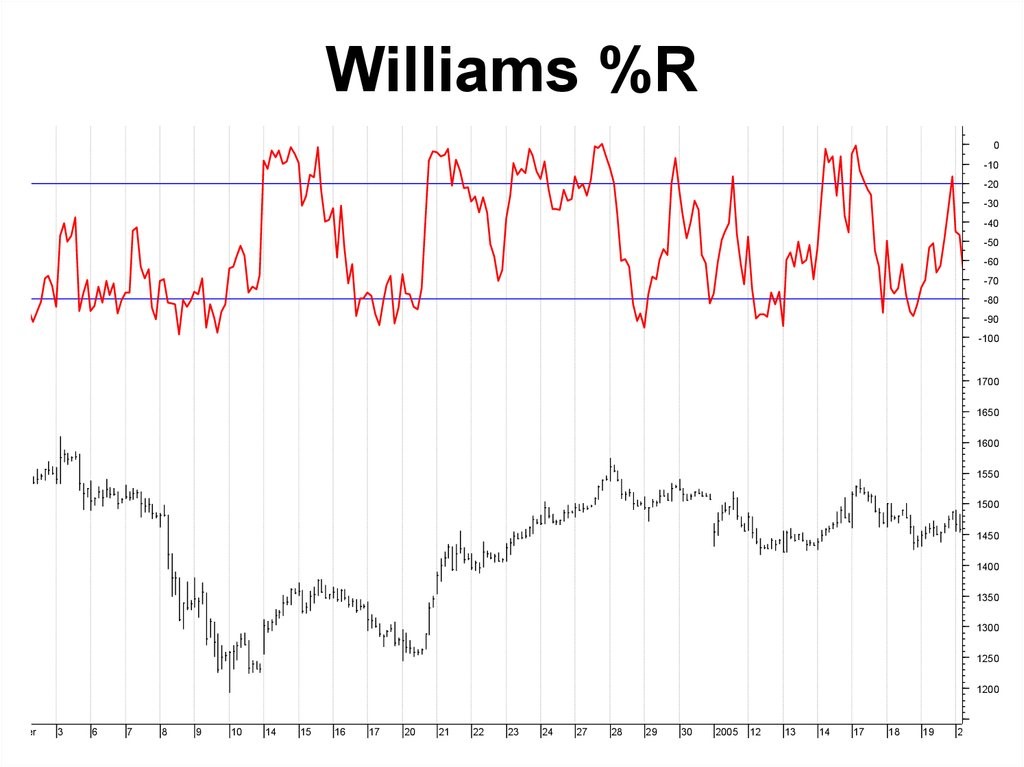
The Williams %R Indicator is a momentum oscillator that helps traders assess whether a currency pair is in an overbought or oversold condition. Developed by Larry Williams, the tool is particularly popular in forex trading due to its simplicity and ability to pinpoint potential market reversals. Unlike other oscillators that use a 0 to 100 scale, the Williams %R operates on a scale of -100 to 0. This range provides clear thresholds for traders: values between -80 and -100 indicate an oversold market, while readings between -20 and 0 suggest an overbought market.
The formula for calculating the Williams Percent Range Indicator is straightforward:
%R = -100 * (Highest High - Closing Price) / (Highest High - Lowest Low)
This calculation spans a user-defined period, often set at 14 periods by default, though traders can adjust this based on their strategy. The result is a percentage that represents where the most recent closing price stands relative to the chosen range.
One of the key strengths of the Williams Indicator is its ability to anticipate potential price reversals. When the market reaches extreme levels, such as being deeply overbought or oversold, the %R often signals a possible shift in direction. However, it is essential to note that these signals are not foolproof and are best used in conjunction with other indicators or trading tools.
How does the Williams %R indicator work?
The Williams %R Indicator operates as a momentum oscillator, helping traders identify overbought and oversold market conditions, which often precede price reversals. Its unique scale, ranging from -100 to 0, distinguishes it from similar tools like the Relative Strength Index (RSI) or Stochastic Oscillator. This range offers a clear view of a currency pair's price position within a specified period.
The indicator works by comparing the most recent closing price to the high-low range over a set period, typically 14 periods. Values closer to -100 indicate that the price is near the lower end of its range, suggesting oversold conditions. Conversely, values closer to 0 imply the price is near the upper end of its range, indicating overbought conditions.
For traders, the key zones to watch are:
- Overbought Zone (-20 to 0): This signals that the price is nearing the top of its recent range, often a precursor to a downward correction.
- Oversold Zone (-80 to -100): This suggests that the price is near the bottom of its range, potentially hinting at an upward reversal.
One notable strength of the Williams %R is its ability to detect momentum shifts early, especially when divergences occur. For instance, if the price continues to climb but the %R fails to reach new highs, it may signal weakening momentum and an impending reversal.

How to use the Williams %R indicator in forex trading
The Williams %R Indicator is a versatile tool that can enhance trading strategies when used correctly. By highlighting overbought and oversold conditions, it helps traders pinpoint potential entry and exit points. To maximize its utility, it’s essential to understand how to interpret its signals and integrate it with broader trading approaches.
Identifying market trends
The Williams %R is particularly effective in confirming market trends. During a strong uptrend, values may frequently hover in the overbought zone (-20 to 0), indicating sustained bullish momentum. Conversely, in a downtrend, the indicator may remain in the oversold zone (-80 to -100), signaling persistent bearish conditions.
Spotting reversals
Traders often use the Williams %R to anticipate reversals at extreme levels. For example, when the indicator moves out of the oversold zone (-80 to -100), it can signal a potential upward price shift. Similarly, exiting the overbought zone (-20 to 0) might suggest an impending downward correction.
Divergence signals
Divergence between the price movement and the indicator provides additional insights. If the price is making new highs while the %R fails to do so, it could indicate weakening momentum, signaling a possible reversal.
Using the indicator on platforms
On trading platforms like MetaTrader 4/5 or TradingView, adding the Williams Percent Range Indicator is simple. Set the desired period (e.g., 14) and observe the plotted oscillator beneath the price chart.
Strategies for trading with the Williams %R indicator
The Williams %R Indicator is a versatile tool that can be integrated into various trading strategies to improve decision-making and optimize results. By combining its insights with other technical analysis methods, traders can develop robust approaches for navigating the forex market.
Breakout strategy
One effective application of the Williams %R is in confirming breakout signals. During periods of consolidation, the indicator can help identify when momentum is building for a breakout. For example, if the price breaks above a resistance level while the %R exits the oversold zone, it may indicate the beginning of a bullish trend. Conversely, a breakdown below support with the %R leaving the overbought zone can confirm a bearish move.
Range trading
In range-bound markets, the indicator helps identify optimal entry and exit points. When the %R moves into the oversold zone near a range’s lower boundary, it signals a potential buying opportunity. Similarly, overbought readings near the upper boundary suggest a possible sell signal.
Combining with other indicators
The Williams Indicator can be paired with moving averages, Bollinger Bands, or MACD to strengthen trading signals. For instance, using it alongside a moving average crossover can confirm trend reversals or continuation patterns, adding an extra layer of confidence to trades.
Scalping in forex
For short-term traders, the Williams %R is particularly useful for scalping strategies. On lower timeframes, it highlights rapid momentum shifts, allowing traders to capitalize on short-lived price movements.
Customizing the Williams %R indicator for better results
One of the key strengths of the Williams %R Indicator is its adaptability. By customizing the indicator to suit specific trading styles and market conditions, traders can enhance its effectiveness and gain more accurate insights.
Adjusting the period settings
The default setting for the Williams Percent Range Indicator is typically 14 periods. While this works well for many traders, adjusting the timeframe can yield better results depending on the trading style. For short-term traders or scalpers, a lower period setting (e.g., 7 or 10) makes the indicator more sensitive to price changes, offering quicker signals. For swing or long-term traders, longer periods (e.g., 20 or 28) help smooth out noise and provide more reliable trends.
Tailoring to market conditions
Market volatility can influence how the Williams %R performs. In highly volatile conditions, extreme readings may occur frequently, leading to potential false signals. Traders can address this by combining the indicator with trend filters, such as moving averages, to confirm market direction and filter out unreliable signals.
Integrating with custom templates
Many trading platforms allow users to create custom templates. Incorporating the Williams %R with additional tools—like Bollinger Bands or Fibonacci retracements—can provide a more holistic view of the market. For example, identifying confluence between oversold conditions and a key Fibonacci level can increase confidence in a buy signal.

Benefits and drawbacks of the Williams %R indicator
Benefits
- Simplicity and Clarity: The Williams %R is easy to interpret, with its -100 to 0 scale clearly delineating overbought and oversold levels. This makes it accessible for traders of all experience levels.
- Effective in Momentum Trading: By highlighting extreme price levels, the indicator helps traders anticipate potential turning points in the market. This is particularly useful for identifying short-term reversals.
- Versatile Across Markets and Timeframes: The Williams %R works well across different currency pairs and trading timeframes, making it a flexible choice for both scalpers and long-term traders.
- Early Signals: The indicator is known for providing early warnings of momentum shifts, giving traders a head start in preparing for possible market changes.
Drawbacks
- False Signals in Volatile Markets: During periods of high market volatility, the Williams %R can produce frequent overbought or oversold readings, which may not always lead to reliable reversals.
- Limited as a Standalone Tool: While useful, the indicator should not be used in isolation. Combining it with other tools, such as trend indicators or volume analysis, is essential for confirming signals.
- Prone to Noise in Short Timeframes: On very short timeframes, the indicator may generate excessive signals, complicating decision-making for scalpers.
Conclusion
The Williams %R Indicator is a versatile and accessible tool that holds immense value for forex traders seeking to refine their technical analysis. Its ability to identify overbought and oversold conditions, signal momentum shifts, and pinpoint potential reversals makes it a reliable asset in navigating the complexities of the forex market.
Developed by Larry Williams, this indicator simplifies market analysis by providing clear visual cues on a scale of -100 to 0. It excels in helping traders identify extremes in price movements, particularly in ranging or consolidating markets. However, its utility extends beyond simple signals, offering insights into momentum divergence and trend confirmations when used in conjunction with other analytical tools.


