SuperTrend Indicator
The Supertrend Indicator is a popular technical analysis tool designed to help traders identify trends in the forex market. It is particularly effective for determining the direction of the market and highlighting potential entry and exit points. The indicator works by combining price movements and volatility, helping traders stay on the right side of a trend while filtering out minor price fluctuations. Unlike oscillators, which measure overbought or oversold conditions, the Supertrend is a trend-following indicator that adapts to market changes, making it useful for both short-term and long-term traders.
Forex traders value the Supertrend Indicator for its simplicity and reliability. Its ability to automatically adjust to changing market conditions allows it to provide clear signals without overwhelming traders with unnecessary complexity. One of its main advantages is that it eliminates the noise of short-term market fluctuations, allowing traders to focus on sustained trends. This helps reduce false signals, making it easier to spot profitable opportunities. Additionally, the Supertrend Indicator can be applied to multiple timeframes, making it versatile for both day trading and swing trading strategies.
The Supertrend Indicator was developed by Olivier Seban, a French financial markets expert. Introduced in the mid-2000s, it was designed as a tool for simplifying trend analysis, particularly in volatile markets like forex. Its core formula is based on the Average True Range (ATR), a measure of volatility that ensures the indicator adjusts dynamically to market conditions, ensuring a more adaptive approach than static indicators. Since its introduction, the Supertrend has gained widespread popularity, being implemented on various trading platforms such as MetaTrader and TradingView.
How the Supertrend Indicator works
The Supertrend Indicator is built using two key components: the Average True Range (ATR) and a multiplier. The ATR measures market volatility by calculating the average range between a currency pair’s high and low prices over a specified period. This allows the Supertrend to adjust dynamically to changing market conditions. The multiplier determines how sensitive the indicator is to price fluctuations. A higher multiplier creates a wider distance between the price and the Supertrend line, filtering out smaller price movements, while a lower multiplier results in more frequent signals due to increased sensitivity to minor price changes.
The formula for the Supertrend line is:
- Upper Band = (Closing Price + ATR * Multiplier)
- Lower Band = (Closing Price - ATR * Multiplier)
When the price moves above the lower band, the Supertrend turns bullish; when it falls below the upper band, the indicator signals a bearish trend.
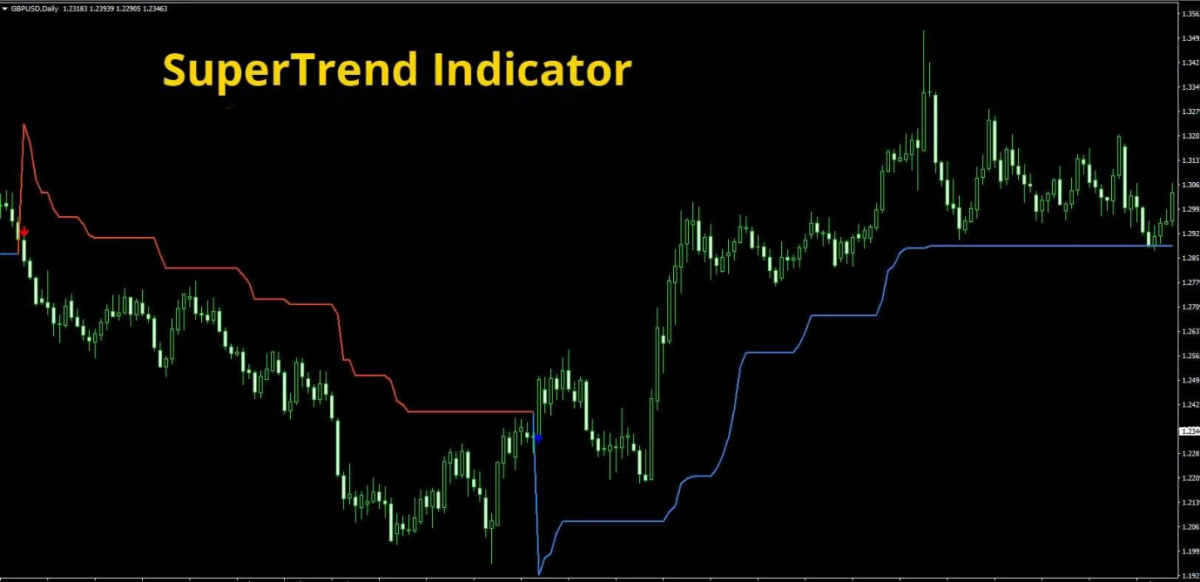
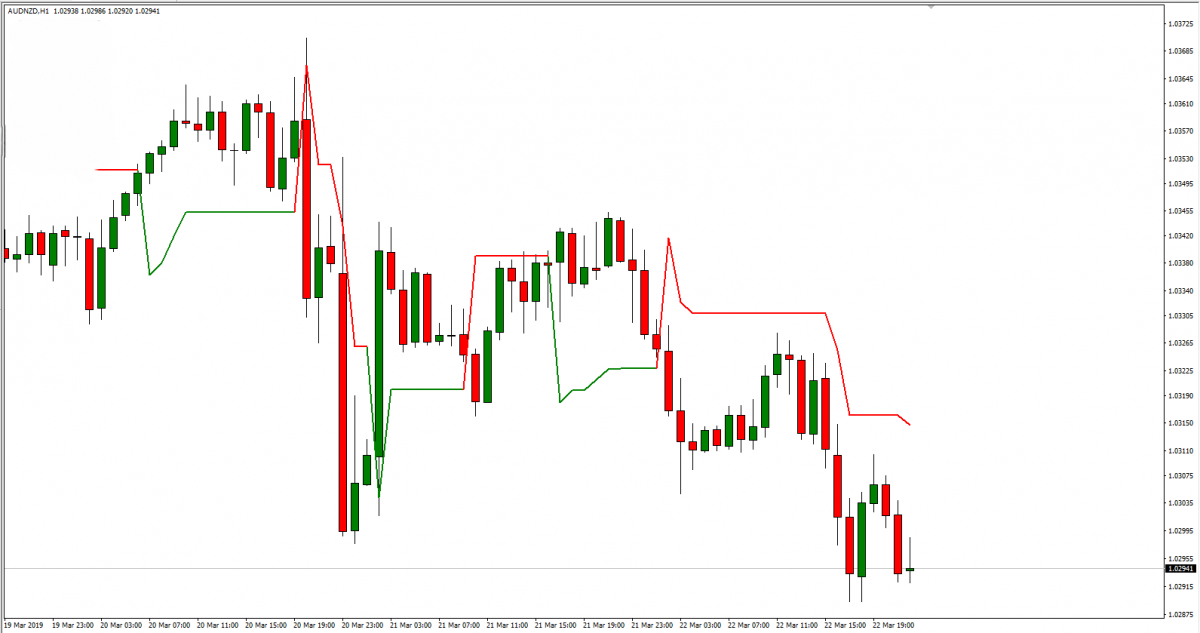
In trending markets, the Supertrend Indicator works well by providing clear buy and sell signals. A green line below the price indicates a bullish trend, while a red line above the price signals a bearish trend. In range-bound or sideways markets, however, the indicator may give false signals, as short-term fluctuations can trigger multiple changes in direction.
Compared to other trend-following indicators like Moving Averages or Parabolic SAR, the Supertrend offers a more adaptive approach, thanks to its ATR-based calculation. This allows it to respond more accurately to sudden market volatility, unlike Moving Averages, which tend to lag in fast-moving markets. Additionally, its simplicity makes it easier for traders to interpret than more complex indicators like the Ichimoku Cloud, making it a favorite among both novice and experienced traders.

Setting up the Supertrend Indicator on trading platforms
TradingView is a popular platform for technical analysis, offering easy access to the Supertrend Indicator. Here’s how to set it up:
- Open TradingView and choose your preferred currency pair and timeframe.
- In the chart window, click on the "Indicators" button at the top.
- Search for "Supertrend" in the indicator search bar.
- Click on "Supertrend" to apply it to your chart.
Once applied, the Supertrend lines will appear, with green indicating a bullish trend and red indicating a bearish trend. You can now use these signals to identify potential entry and exit points in your forex trades.
After applying the Supertrend Indicator, you can adjust its settings for better performance in different market conditions. The two primary settings are the ATR period and the multiplier. The ATR period determines how many past periods are considered in the volatility calculation. Common settings include 10, 14, or 20 periods, with shorter periods being more sensitive to price changes. The multiplier typically ranges from 1.5 to 3, with higher values filtering out more noise but potentially delaying signals. Customizing these settings allows traders to adapt the indicator to various forex pairs and trading strategies.
Both MetaTrader 4 (MT4) and TradingView are highly compatible with the Supertrend Indicator, offering features like easy setup and customizable parameters. TradingView’s user-friendly interface and real-time data visualization make it ideal for beginners. Meanwhile, MT4 offers advanced trading tools and automated strategies, allowing traders to integrate the Supertrend Indicator into Expert Advisors (EAs) for algorithmic trading.
Supertrend trading strategy
The Supertrend Indicator is straightforward, making it ideal for beginner traders. Its core strategy revolves around trend-following, where traders use the indicator’s signals to determine when to enter or exit a trade based on the current market trend. When the Supertrend line turns green and moves below the price, it signals a potential buy opportunity. Conversely, when the line turns red and moves above the price, it suggests a sell opportunity. This simplicity helps new traders make quick, informed decisions without needing extensive technical knowledge.
A basic trend-following strategy using Supertrend is to enter a trade when the trend changes. For a buy signal, traders should look for the Supertrend line to turn green, indicating a shift to an uptrend. Entering a sell signal happens when the Supertrend line turns red, showing a potential downtrend. To improve trade timing, it is important to confirm that the price has broken past key support or resistance levels, further validating the trend.
While the Supertrend Indicator works well alone, combining it with other tools can increase trading accuracy. For example, pairing it with a Moving Average helps confirm the direction of the overall trend. Similarly, combining it with the Relative Strength Index (RSI) can filter out false signals by confirming overbought or oversold conditions, enhancing trade precision.
The Supertrend Indicator is versatile and can be adapted to different forex pairs and timeframes. Traders using shorter timeframes (e.g., 15-minute or 1-hour charts) may want to use a lower ATR period and multiplier to capture smaller price movements. On the other hand, swing traders using daily or weekly charts may benefit from higher settings to filter out minor fluctuations and focus on longer-term trends. Adjusting the settings based on market volatility and the specific characteristics of a currency pair can improve the strategy’s overall effectiveness.

Advantages and limitations of the Supertrend Indicator
One of the primary advantages of the Supertrend Indicator is its effectiveness in volatile markets, such as forex. Since the Supertrend is based on the Average True Range (ATR), which measures market volatility, it adjusts dynamically to price changes. This adaptability helps traders avoid being misled by small price movements, which are common in volatile conditions. The indicator also provides clear buy and sell signals, making it particularly useful in fast-moving markets where quick decisions are needed. Its simplicity allows traders to easily follow trends without getting overwhelmed by complex analysis.
Despite its strengths, the Supertrend Indicator is not immune to generating false signals, especially in sideways or choppy markets. In these conditions, the price may frequently cross above and below the Supertrend line, leading to false buy and sell signals. To avoid these dangers, traders should combine the Supertrend with other indicators like Moving Averages or the Relative Strength Index (RSI) for confirmation. Additionally, using higher multiplier settings can help filter out minor fluctuations, reducing the chance of false signals.
To improve the Supertrend’s effectiveness, it’s important to configure the ATR period and multiplier settings based on the volatility of the currency pair being traded. For highly volatile pairs like GBP/JPY, a higher multiplier will better account for large price swings, while for less volatile pairs like EUR/USD, a lower setting may capture trends more accurately. It’s also advisable to backtest the Supertrend strategy on historical data to fine-tune the parameters for different market conditions and timeframes.
Using the Supertrend Indicator in forex trading
To illustrate the use of the Supertrend Indicator in forex trading, let's examine its application in trading the EUR/USD currency pair. A trader monitoring the EUR/USD on a daily chart observes that the Supertrend line has turned green, indicating an uptrend. The trader enters a long position at this point, buying EUR/USD at 1.1200. The Supertrend continues to stay green, confirming the ongoing bullish trend. Over the next week, the price steadily rises to 1.1400. Following the Supertrend strategy, the trader stays in the position, as the indicator has not yet switched to a sell signal.
In this case, the Supertrend Indicator successfully helped the trader ride the uptrend, capturing a 200-pip gain before the indicator flipped to red, signaling an exit. This successful trade highlights the strength of the Supertrend in clearly defining trends and allowing traders to stay in a trade for maximum profit.
However, not all trades using the Supertrend are successful. In choppy markets, such as during a consolidation period, the indicator may produce false signals. For example, if the same trader had used the Supertrend on a 1-hour chart during a sideways market, they might have been whipsawed in and out of trades due to frequent trend shifts. By combining the Supertrend with confirmation from other indicators (e.g., RSI) and using a longer timeframe, the trader can avoid these pitfalls and improve the strategy’s overall performance.
Conclusion
The Supertrend Indicator is a valuable tool for forex traders, especially those looking for a simple yet effective way to follow trends and manage trades. By combining price action with volatility, the Supertrend helps traders filter out short-term fluctuations and focus on the overall market direction. Its clear buy and sell signals make it user-friendly, allowing traders of all experience levels to easily identify entry and exit points in both bullish and bearish markets.
One of the key benefits of the Supertrend Indicator is its adaptability to different market conditions, thanks to its foundation on the Average True Range (ATR). This ensures that the indicator adjusts to volatile periods, making it particularly useful in the forex market, where currency pairs often experience sharp price movements. Despite its advantages, traders should be aware of its limitations in sideways markets, where false signals can occur. Combining the Supertrend with other technical indicators like Moving Averages or the Relative Strength Index (RSI) can help enhance its accuracy.


