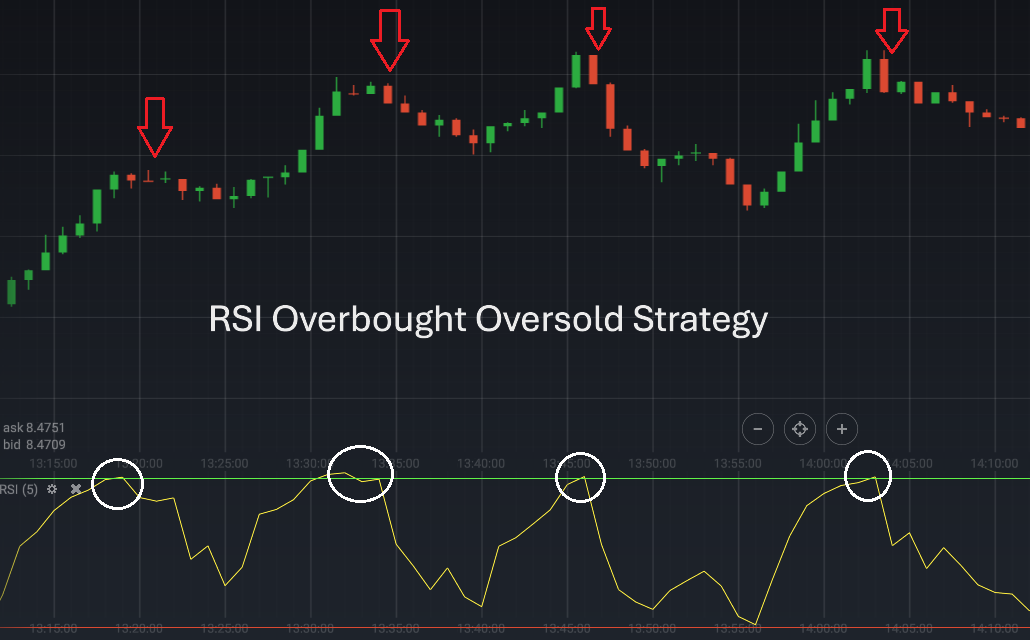
RSI overbought oversold strategy
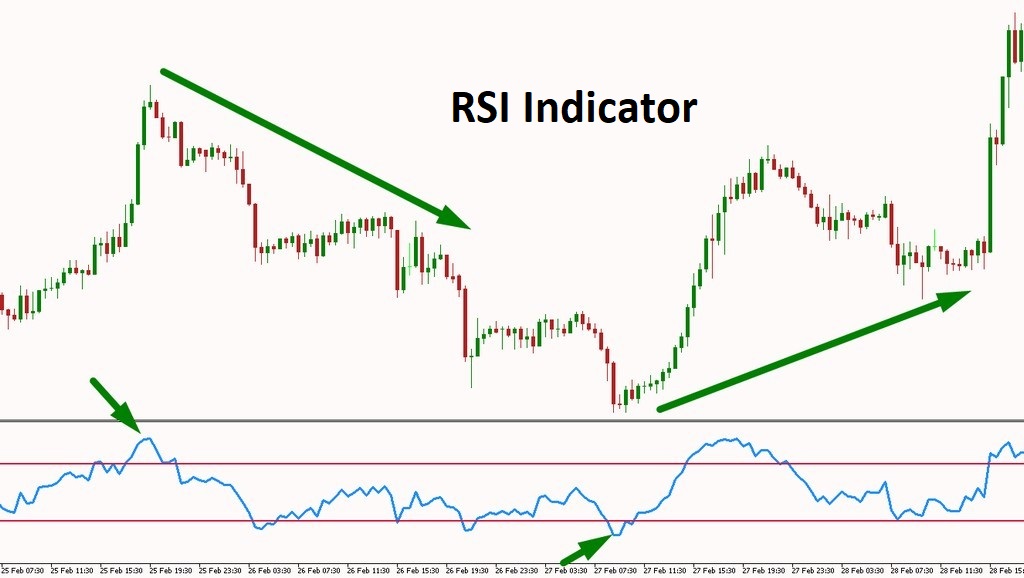
The Relative Strength Index (RSI) is one of the most widely used technical indicators in forex trading, valued for its simplicity and effectiveness in assessing market momentum. Developed by J. Welles Wilder Jr. in 1978, the RSI is a momentum oscillator that measures the speed and magnitude of price movements over a specified period. By oscillating between 0 and 100, it provides traders with a clear visual representation of whether a currency pair may be overbought or oversold, helping them identify potential trend reversals or continuation patterns.
A core feature of the RSI is its ability to pinpoint overbought and oversold zones, which are critical levels in technical analysis. Typically, an RSI value above 70 indicates an overbought condition, suggesting that a currency pair might be overvalued and due for a correction or pullback. Conversely, an RSI reading below 30 signals an oversold condition, meaning the asset may be undervalued and poised for a potential rebound. These zones offer traders valuable insights into market psychology and price action, making the RSI an indispensable tool in a trader’s arsenal.
Understanding overbought and oversold Zones
In forex trading, overbought and oversold zones are critical concepts that help traders evaluate whether a currency pair is priced beyond its fair value range. The Relative Strength Index (RSI) is the primary tool used to identify these zones, providing a numerical value between 0 and 100 that reflects the asset's momentum.
An overbought zone is defined as an RSI value above 70, indicating that the currency pair may have been excessively bought over a short period. This condition often suggests that bullish momentum is losing steam and that a price correction or reversal may be imminent. For example, if a forex pair such as EUR/USD has an RSI reading of 75, traders might interpret this as a signal to consider potential selling opportunities, particularly if other indicators confirm the weakening uptrend.
In contrast, an oversold zone occurs when the RSI dips below 30. This condition implies that the asset may be undervalued or excessively sold, possibly leading to a reversal in the bearish trend. For instance, if the USD/JPY currency pair shows an RSI value of 25, it could signal that bearish momentum is waning, presenting a possible buying opportunity as the price rebounds.
The distinction between RSI overbought vs. oversold zones lies in their implications for market trends. Overbought conditions typically warn of potential downward movements, while oversold conditions hint at possible upward recoveries. However, traders should exercise caution as these signals are not guarantees, especially in trending markets where the RSI can remain in extreme zones for extended periods. By combining RSI analysis with other tools like trendlines and moving averages, traders can gain a more balanced perspective.
Key components of the RSI overbought oversold Strategy
To effectively use this strategy, understanding its key components is essential.
Setting the RSI period
The standard RSI calculation uses a 14-period timeframe, as recommended by its creator, J. Welles Wilder Jr. This setting strikes a balance between sensitivity and accuracy. However, shorter timeframes, such as a 9-period RSI, can provide more responsive signals for scalping or day trading, while longer periods (e.g., 21) reduce noise for swing traders.
Overbought and oversold thresholds
While the default overbought and oversold levels are set at 70 and 30, respectively, traders can adjust these thresholds based on market volatility. For highly volatile forex pairs like GBP/JPY, traders might use 80 for overbought and 20 for oversold, filtering out false signals in choppy markets.
Divergence analysis
RSI divergence occurs when the indicator’s movement diverges from price action. For example, a bearish divergence appears when prices reach higher highs, but the RSI forms lower highs, signaling weakening momentum. Conversely, a bullish divergence suggests potential reversals during downtrends.
Price action confirmation
Combining RSI readings with price action patterns, such as support and resistance levels or candlestick formations, enhances the strategy’s reliability. For instance, an oversold RSI near a key support zone could indicate a high-probability buying opportunity.
Step-by-step guide to using the RSI overbought oversold strategy
Successfully implementing the RSI overbought oversold strategy requires a systematic approach to ensure accuracy and consistency.
Step 1: Identify overbought and oversold zones
Begin by setting up the RSI indicator on your trading platform. Use the standard 14-period RSI unless your strategy calls for a customized setting. Look for RSI values above 70 to identify overbought zones, where a potential reversal or price correction might occur. Similarly, monitor RSI values below 30 to detect oversold zones, which could signal a price rebound.
Step 2: Confirm signals with other indicators
While the RSI is a powerful tool, relying on it alone can lead to false signals. To confirm potential reversals, combine RSI readings with other technical indicators such as moving averages, Bollinger Bands, or MACD. For example, a bearish RSI signal in an overbought zone can be validated if the price also crosses below a key moving average.
Step 3: Look for divergences
Divergences between the RSI and price action are strong signals for potential trend changes. A bullish divergence occurs when the RSI forms higher lows while the price creates lower lows, suggesting a weakening downtrend. A bearish divergence appears when the RSI makes lower highs while the price forms higher highs, indicating a weakening uptrend.
Step 4: Execute trades and manage risk
Once the RSI signal is confirmed, place trades accordingly. Use stop-loss orders to protect against unfavorable movements and set take-profit levels to lock in gains. For example, in an oversold condition with confirmation, a buy trade can be placed with a stop-loss below the recent low. Proper risk management ensures consistent performance over time.
Limitations and risks of the RSI strategy
Like any technical indicator, the RSI is not infallible, and traders must exercise caution when using it in live markets.
False signals in trending markets
One of the primary challenges of using the RSI is its tendency to generate false signals during strong trends. For example, in a robust uptrend, the RSI can remain in the overbought zone (above 70) for extended periods without a price reversal, leading traders to prematurely sell. Similarly, in a strong downtrend, the RSI may remain oversold (below 30) for a prolonged time, causing traders to enter long positions too early. This underscores the importance of understanding market context—RSI works best in range-bound or consolidating markets rather than trending environments.
Over-reliance on RSI signals
Relying solely on RSI readings can be risky, as the indicator does not account for broader market factors such as economic news or geopolitical events, which can drive significant price movements. To mitigate this, traders should combine RSI signals with other tools, such as trendlines, moving averages, or fundamental analysis, to build a more comprehensive trading strategy.
Customizing RSI settings
Another limitation is that the default 14-period RSI settings may not suit all forex pairs or trading styles. For example, volatile currency pairs like GBP/JPY may require adjusted thresholds, such as 80 for overbought and 20 for oversold, to avoid excessive noise.
Advanced tips for mastering RSI overbought oversold strategies
The RSI overbought oversold strategy is a solid foundation for forex traders, but refining it with advanced techniques can significantly improve its effectiveness.
Combine RSI with other indicators
Using RSI alongside complementary indicators can filter out false signals and confirm potential trade setups. For example, Bollinger Bands can help identify overextended price movements that align with RSI overbought or oversold conditions. Similarly, MACD (Moving Average Convergence Divergence) can provide confirmation of momentum shifts, strengthening the reliability of RSI signals.
Analyze multiple timeframes
Conducting multi-timeframe analysis with the RSI adds a broader perspective to your strategy. For instance, a bullish divergence on the RSI in a 4-hour chart can provide context for short-term oversold signals on a 15-minute chart. This approach ensures alignment with the larger trend while identifying precise entry and exit points.
Adjust RSI settings for specific pairs
Different forex pairs have varying levels of volatility, so tailoring RSI settings to the asset can enhance results. For major pairs like EUR/USD, the standard 14-period RSI and thresholds of 70/30 work well. However, for highly volatile pairs such as GBP/JPY or exotic pairs, tighter thresholds (e.g., 80/20) can better accommodate rapid price movements.
Use RSI with support and resistance levels
RSI signals are more reliable when aligned with key support or resistance zones. For example, an oversold RSI near a well-established support level increases the likelihood of a successful reversal trade. Similarly, an overbought RSI near resistance strengthens the case for a short position.
Conclusion
The RSI overbought oversold strategy is a cornerstone of technical analysis, offering traders a simple yet powerful method to evaluate market momentum and identify potential reversal points. By interpreting the Relative Strength Index (RSI) and its key levels—overbought (above 70) and oversold (below 30)—forex traders can pinpoint areas where currency pairs may be overvalued or undervalued. This insight enables them to make more informed trading decisions, whether they aim to enter, exit, or adjust positions.
However, the RSI should not be viewed as a standalone solution. While it excels in identifying turning points in range-bound markets, its reliability decreases in trending markets, where overbought or oversold conditions can persist without a price reversal. This limitation highlights the importance of combining the RSI with additional tools, such as moving averages, trendlines, candlestick patterns, and fundamental analysis, to create a more holistic trading strategy.