Horizontal Channel strategy in forex
One of the most straightforward yet effective approaches in technical analysis is the Horizontal Channel Strategy. This method allows traders to identify price patterns and capitalize on market consolidation phases, where price action moves within a defined range.
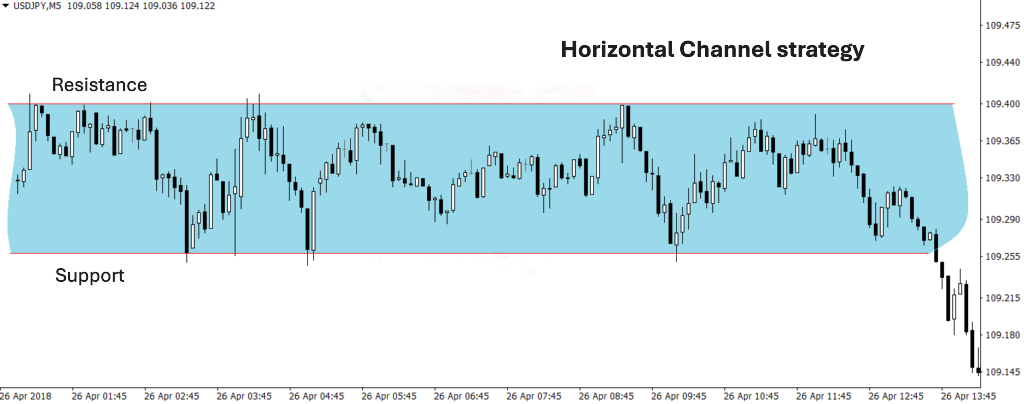
A horizontal channel, sometimes referred to as a price range, forms when the market lacks a clear upward or downward trend. In this scenario, the price oscillates between two key levels: support, which represents the lower boundary, and resistance, the upper boundary. These levels create a “channel” where the price is contained, providing traders with clear opportunities to buy near support and sell near resistance.
Understanding Horizontal Channels in forex
In forex trading, horizontal channels represent periods of market consolidation where prices move within a defined range, neither trending upward nor downward. These channels are characterized by two key levels: support and resistance. The support level forms the lower boundary of the channel and acts as a “floor,” where downward price movement tends to stall or reverse. On the other hand, the resistance level creates the upper boundary, functioning as a “ceiling” that limits upward price movements.
The movement of prices within a horizontal channel reflects a balance between buyers and sellers. Neither side is dominant, resulting in a range-bound pattern. This phase often indicates indecision in the market, where traders are waiting for new information, such as economic data releases or central bank announcements, to determine the next major price direction.
Horizontal channels are frequently observed in major currency pairs like EUR/USD or GBP/USD during low-volatility periods. For example, if EUR/USD consistently oscillates between 1.0500 (support) and 1.0700 (resistance) over several trading sessions, it forms a horizontal channel. Traders can leverage this predictable range to make strategic decisions.
This pattern is especially valuable for range traders who aim to buy at the support level and sell at resistance. However, it is important to confirm the boundaries of a horizontal channel by ensuring multiple price touches at both levels.
How to identify Horizontal Channels on a forex chart
Horizontal channels are formed when the price repeatedly moves between two parallel levels: support and resistance. Recognizing these levels on a forex chart involves careful observation and the use of technical tools.
1. Spotting support and resistance levels
The first step in identifying a horizontal channel is to locate areas where the price consistently reverses direction. The support level is the lower boundary, where the price tends to bounce upward due to buying pressure. Conversely, the resistance level is the upper boundary, where selling pressure prevents the price from rising further. To confirm a valid horizontal channel, there should be at least two or three price touches at both levels without the price breaking through.
2. Drawing the channel
Once the support and resistance levels are identified, traders can draw two parallel horizontal lines connecting these points. This creates the visual “channel” within which the price moves.
3. Using indicators for validation
While horizontal channels can often be identified manually, technical tools can enhance accuracy. Indicators like Relative Strength Index (RSI) or Moving Averages help confirm the range-bound movement. RSI, for instance, can signal overbought or oversold conditions, aligning with price touches at resistance or support.
4. Choosing the right timeframe
Horizontal channels are visible across different timeframes, but shorter timeframes (e.g., 1-hour or 4-hour charts) are often used by day traders, while swing traders may prefer daily or weekly charts.
Trading strategies within Horizontal Channels
Horizontal channels offer forex traders two primary strategies: range trading and breakout trading. Each approach capitalizes on different aspects of price behavior within or beyond the channel and can be adapted to suit varying risk appetites and trading goals.
1. Range trading strategy
Range trading involves exploiting the predictable price oscillations within the horizontal channel. Traders aim to buy near the support level (the lower boundary) and sell near the resistance level (the upper boundary). For instance, if the price of GBP/USD fluctuates between 1.2100 (support) and 1.2300 (resistance), traders could set a buy order near 1.2100 with a stop-loss slightly below the support. Similarly, a sell order near 1.2300 with a stop-loss just above the resistance level minimizes risk. To maximize profitability, traders often use oscillators like the RSI to confirm overbought or oversold conditions at the channel boundaries.
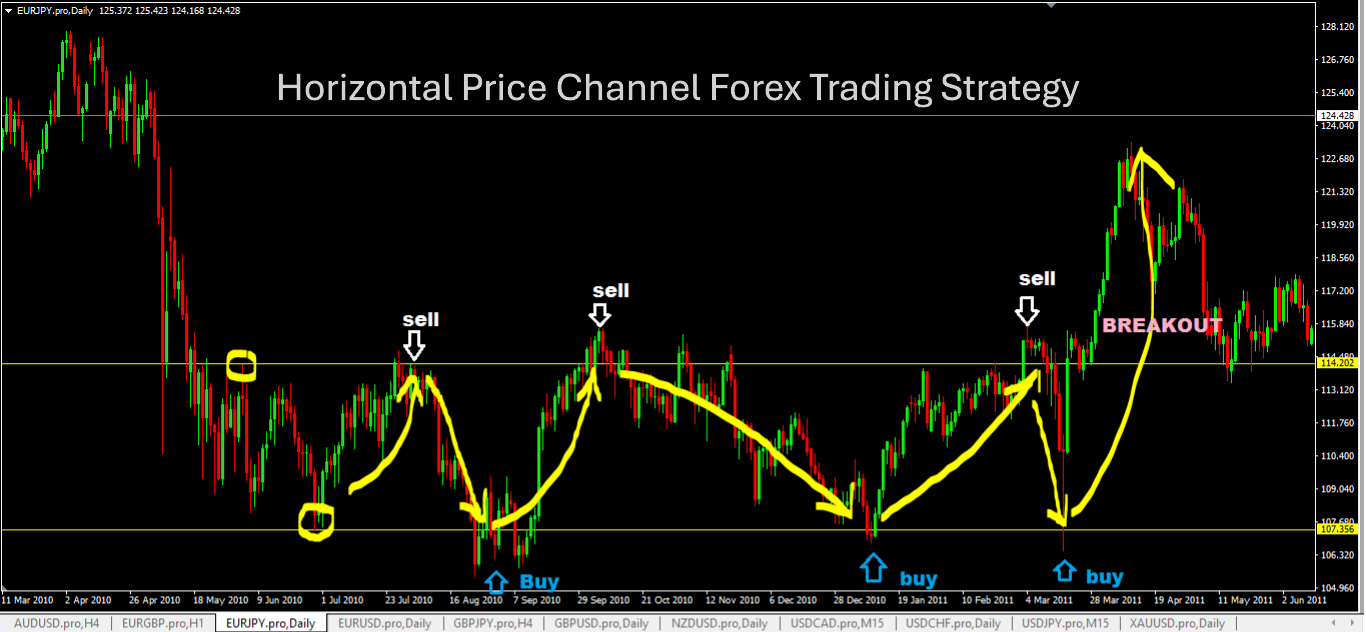
2. Breakout trading strategy
When the price breaks through either the support or resistance level of the horizontal channel, it often signals the beginning of a new trend. Breakout traders focus on identifying these moments. For example, a breakout above the resistance level might indicate bullish momentum, prompting traders to go long. Conversely, a break below support could signal a bearish trend. To avoid being misled by false breakouts, traders often wait for confirmation, such as a candlestick closing beyond the channel boundary or increased trading volume.
Risk management
Regardless of the strategy, effective risk management is essential. Traders should set clear stop-loss and take-profit levels, maintain proper position sizing, and use a favorable risk-reward ratio (e.g., 1:2 or higher). This ensures long-term consistency and minimizes potential losses.
Advantages of the Horizontal Channel strategy
Clarity and simplicity
Horizontal channels provide clear visual cues for identifying entry and exit points. The defined support and resistance levels create a straightforward framework, making it accessible even for beginners.
Adaptability across timeframes and currency pairs
This strategy works well on a variety of timeframes, from short-term charts like 1-hour or 4-hour to longer-term daily or weekly charts. It is equally effective across different currency pairs, including major, minor, and even exotic pairs.
Range of trading opportunities
Traders can capitalize on two key opportunities: range trading within the channel and breakout trading when the price moves beyond the boundaries. This flexibility allows traders to adapt to changing market conditions.
Compatibility with other indicators
Horizontal channels can be easily combined with tools such as moving averages, Bollinger Bands, and oscillators like RSI or MACD, increasing the reliability of trading signals.
Limitations of the Horizontal Channel strategy
False breakouts
One of the main challenges is distinguishing between real and false breakouts. A false breakout occurs when the price briefly moves beyond the channel boundary before returning, potentially leading to premature trades and losses.
Ineffectiveness in trending markets
The strategy is most effective during consolidation phases. In strongly trending markets, horizontal channels rarely form, limiting its applicability.
Dependence on accurate identification
Misjudging support and resistance levels can lead to inaccurate channels and poor trade execution. This requires traders to exercise precision and patience.
Real-Life examples of Horizontal Channel strategy in forex
1. EUR/USD Horizontal Channel (June 2021 – August 2021)
During the summer of 2021, the EUR/USD currency pair traded within a well-defined horizontal channel between 1.1700 (support) and 1.1900 (resistance). This pattern emerged as traders awaited announcements from the European Central Bank (ECB) and the Federal Reserve regarding monetary policy amidst inflation concerns.
Observation: On the daily chart, the price consistently bounced off support at 1.1700 and resistance at 1.1900, creating a clear range. Traders using the horizontal channel strategy had multiple opportunities to profit by buying at the support and selling at the resistance.
Outcome: In mid-August 2021, EUR/USD broke below the 1.1700 support level, signaling the end of the horizontal channel and the start of a bearish trend. This breakout highlighted the importance of watching volume and candlestick confirmation during such events.
2. GBP/USD Horizontal Channel (September 2020 – November 2020)
Between September and November 2020, GBP/USD moved in a horizontal range between 1.2850 (support) and 1.3150 (resistance). This occurred during a period of uncertainty surrounding Brexit negotiations and the COVID-19 pandemic's economic impact.
Observation: On the 4-hour chart, GBP/USD repeatedly reversed near these key levels. Oscillators like the Relative Strength Index (RSI) helped traders identify overbought conditions near 1.3150 (resistance) and oversold conditions near 1.2850 (support).
Outcome: In late November 2020, the pair broke above the 1.3150 resistance level, driven by renewed optimism in Brexit talks. This breakout led to a significant bullish rally.
3. USD/JPY Horizontal Channel (March 2023 – May 2023)
In early 2023, the USD/JPY pair entered a horizontal channel as it consolidated between 132.00 (support) and 137.00 (resistance). This period followed the Bank of Japan's continued dovish monetary policy stance, which created indecision among traders.
Observation: The daily chart showed multiple price touches at both support and resistance levels, creating a well-defined channel. Traders utilized this range for short-term trades, buying near support and selling near resistance.
Outcome: In May 2023, USD/JPY broke above the 137.00 resistance level, fueled by stronger-than-expected U.S. economic data, leading to a sustained bullish trend.
Conclusion
The Horizontal Channel Strategy in forex trading is a simple yet powerful tool that enables traders to capitalize on range-bound markets and identify potential breakouts. By focusing on the natural oscillation of prices between support and resistance levels, traders can make calculated decisions to enter and exit trades with greater precision.
Range trading within horizontal channels allows traders to benefit from predictable price movements, while breakout trading offers opportunities to capture significant trends when the price escapes the channel's boundaries. However, it’s important to acknowledge that no strategy is without limitations. Horizontal channels are most effective during periods of consolidation and low volatility, making them less useful in trending or highly volatile markets.