High low breakout strategy
The high low breakout strategy is a time-tested technique in Forex trading, designed to harness the power of price movements around key levels. It revolves around identifying the highest and lowest points within a specific timeframe—daily, weekly, or monthly—and leveraging these levels to anticipate breakouts. A breakout occurs when the price moves beyond these boundaries with momentum, often signaling the start of a new trend or a continuation of an existing one. This strategy is especially valued for its simplicity, adaptability, and potential to capture substantial price moves.
One of the primary reasons the high low breakout strategy is so effective is that it focuses on psychological and technical barriers in the market. Highs and lows often represent points of significant buying or selling pressure, making them critical zones to watch. For instance, when the price breaks above the previous day’s high, it may indicate strong bullish momentum, while a break below the low may signal bearish sentiment.
Market highs and lows in forex
In Forex trading, market highs and lows serve as critical reference points for price action analysis. These levels, representing the highest and lowest prices within a given timeframe, are essential for identifying support and resistance zones where traders often make key decisions.
Daily highs and lows are the most commonly used, particularly by intraday and scalping traders who focus on short-term price movements. These levels capture the range of a single trading session and often act as psychological thresholds. When the price breaks above the daily high, it indicates bullish momentum, while a break below the daily low suggests bearish sentiment. On a larger scale, weekly and monthly highs and lows are critical for swing and position traders aiming to capitalize on extended trends.
The significance of highs and lows lies in their ability to reflect market sentiment. These levels often coincide with areas of strong buying or selling interest, creating points of resistance or support. For instance, when a currency pair approaches a high, traders might anticipate profit-taking or increased selling pressure. Conversely, when approaching a low, buying interest may emerge.
Key tools like candlestick charts, pivot points, and Fibonacci retracement levels help traders identify and confirm these critical zones. Additionally, combining technical insights with economic data—such as employment reports or central bank decisions—can provide valuable context for why the market is reacting at certain levels.
Types of high low breakout strategies
The high low breakout strategy is highly adaptable, allowing traders to apply it across various timeframes and adapt it to their trading styles. Each variation of the strategy focuses on a specific timeframe, providing opportunities to capitalize on different market dynamics.
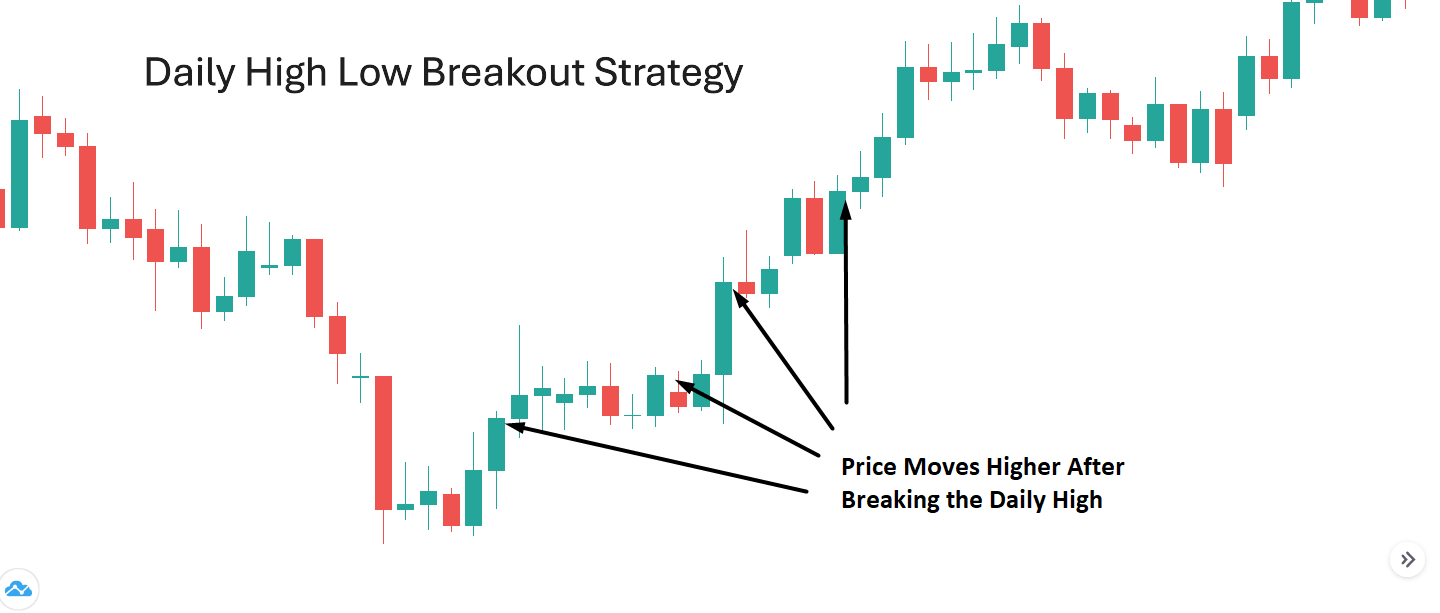
Daily high low breakout strategy
This approach focuses on the highest and lowest price levels of the previous trading day. Day traders often use this variation to identify intraday breakout opportunities. For instance, if the price breaks above the previous day’s high, it may indicate bullish momentum, while a break below the low signals potential bearish moves. Tools like candlestick patterns, pivot points, and moving averages can help confirm breakout signals, making this strategy ideal for short-term trades.
Weekly high low breakout strategy
Weekly highs and lows are critical for swing traders aiming to capture larger price movements. By analyzing the price action of an entire week, traders can identify strong support and resistance levels. A breakout beyond these points often signifies significant shifts in market sentiment, particularly when combined with indicators like Bollinger Bands or trendlines. This strategy is especially useful for traders who prefer medium-term positions.
Monthly high low breakout strategy
Focusing on monthly highs and lows is best suited for position traders targeting long-term trends. Breakouts at these levels are often influenced by macroeconomic factors, such as central bank policies or geopolitical events. Monitoring these factors alongside technical levels helps traders anticipate sustained moves.
Tools and indicators for the high low breakout strategy
Effectively applying the high low breakout strategy requires the use of reliable tools and indicators to identify key levels, confirm breakouts, and manage trades.
Charting platforms
Popular platforms like MetaTrader 4 (MT4), MetaTrader 5 (MT5), and TradingView provide traders with advanced charting capabilities. These platforms allow users to mark high and low levels for specific timeframes and utilize custom indicators or scripts to automate breakout analysis. Interactive tools make it easy to adjust levels dynamically as the market evolves.
Technical indicators
Several technical indicators complement the high low breakout strategy by confirming the validity of breakouts:
- Bollinger Bands help gauge market volatility. A breakout beyond the bands often signals momentum in the direction of the breakout.
- Moving Averages, particularly exponential moving averages (EMAs), help identify trends and filter false breakouts.
- Volume Indicators, such as the On-Balance Volume (OBV), are crucial for validating breakouts. Increased volume on a breakout suggests strength in the price movement.
- Pivot Points can reinforce key support and resistance levels, aligning with high and low thresholds.
Real-time news and alerts
Breakouts are often triggered by market-moving events. Tools like Reuters, Bloomberg, or Forex Factory provide real-time updates on economic releases, interest rate decisions, and geopolitical developments. Setting alerts on platforms like TradingView ensures traders don’t miss critical breakout opportunities.
Practical steps to trade the high low breakout strategy
Implementing the high low breakout strategy requires a systematic approach to identify key levels, confirm signals, and manage risks.
Identify high and low levels
Begin by marking the high and low of your chosen timeframe—daily, weekly, or monthly. For instance, the previous day’s high and low are crucial for day traders, while weekly or monthly levels are better suited for swing and position traders. Use charting platforms like MetaTrader or TradingView to draw horizontal lines at these key levels.
Wait for a breakout
Monitor the price action near the identified levels. A breakout occurs when the price moves beyond the high or low with strong momentum. Ensure the breakout is confirmed by factors such as candlestick patterns (e.g., a full-bodied bullish candle above the high) or increased trading volume.
Confirm with indicators
To avoid false breakouts, use indicators like Bollinger Bands to measure volatility or moving averages to determine trend direction. Volume indicators, such as the Accumulation/Distribution Line, can also validate the strength of the breakout.
Place entry, stop-loss, and take-profit levels
Enter the trade as soon as the breakout is confirmed. Set a stop-loss just below the breakout level (for long positions) or above it (for short positions) to protect against reversals. Use tools like pivot points or Fibonacci retracements to determine logical take-profit targets.
Monitor and adjust
Monitor the trade closely and be prepared to adjust your stop-loss or take-profit as the market moves. Incorporating these practical steps ensures a disciplined approach to the high low breakout strategy, minimizing risks and maximizing profitability in Forex trading.
Common mistakes in trading high low breakouts
While the high low breakout strategy is straightforward, it’s not without challenges.
Misidentifying false breakouts
One of the most frequent errors is entering a trade based on a false breakout. This occurs when the price briefly moves beyond a high or low but quickly reverses, trapping traders. To avoid this, confirm breakouts with indicators like volume analysis or Bollinger Bands. A breakout accompanied by high trading volume is more likely to be genuine than one occurring in low-volume conditions.
Ignoring risk management
Overleveraging or trading without a stop-loss is a critical mistake. Forex markets can be highly volatile, and even strong breakouts can reverse unexpectedly. Always set stop-loss levels just outside the breakout zone to limit potential losses while ensuring your position size aligns with your overall risk tolerance.
Overtrading breakouts
Breakout opportunities are not always frequent, yet some traders feel compelled to trade every move. Overtrading can lead to exhaustion and poor decision-making. Focus on quality setups by waiting for well-defined breakouts supported by technical and fundamental factors.
Disregarding fundamental analysis
Breakouts are often influenced by market-moving events, such as interest rate decisions or major economic reports. Ignoring these events can result in missed opportunities or poorly timed trades. Use tools like Forex Factory or Bloomberg to stay updated on relevant news.
Conclusion
One of the key strengths of the high low breakout strategy lies in its simplicity. Traders can easily mark the previous high and low levels on their charts and monitor price action around these thresholds. However, its effectiveness is enhanced when combined with technical tools such as moving averages, Bollinger Bands, and volume indicators, as well as real-time news and fundamental analysis. For example, central bank announcements or significant economic data releases can act as catalysts for strong breakout movements.
Risk management is a foundation of this strategy. Setting appropriate stop-loss levels and calculating position sizes are essential to safeguard against unexpected reversals or false breakouts. Furthermore, practicing patience and avoiding overtrading can prevent costly mistakes.
In summary, the high low breakout strategy remains a beneficial tool for both beginner and experienced traders. Its ability to combine technical precision with market context makes it a reliable method for navigating Forex markets.