Donchian Channel Breakout strategy
The Donchian Channel Breakout Strategy is a widely recognized technique in technical analysis, offering traders a systematic way to identify potential market trends and trading opportunities. Rooted in the principles of trend-following, this strategy leverages the Donchian Channel indicator, which was developed by Richard Donchian, often regarded as the "Father of Trend Following." His innovative work laid the foundation for many modern trading systems and continues to influence trading strategies today.
At its core, the Donchian Channel is a volatility-based tool that plots the highest high and lowest low of a price over a specified period. By doing so, it creates an upper band, a lower band, and a midline that visually encapsulate price movement within a defined range. This indicator serves as a valuable resource for traders aiming to capture breakouts—moments when the price moves decisively beyond the defined range, signaling the potential start of a new trend.
The Donchian Channel breakout strategy is particularly popular in forex trading due to its ability to adapt to dynamic market conditions. Whether trading currency pairs, stocks, or commodities, this strategy helps traders identify clear entry and exit points, providing structure to an often unpredictable market.
Understanding the Donchian Channel indicator
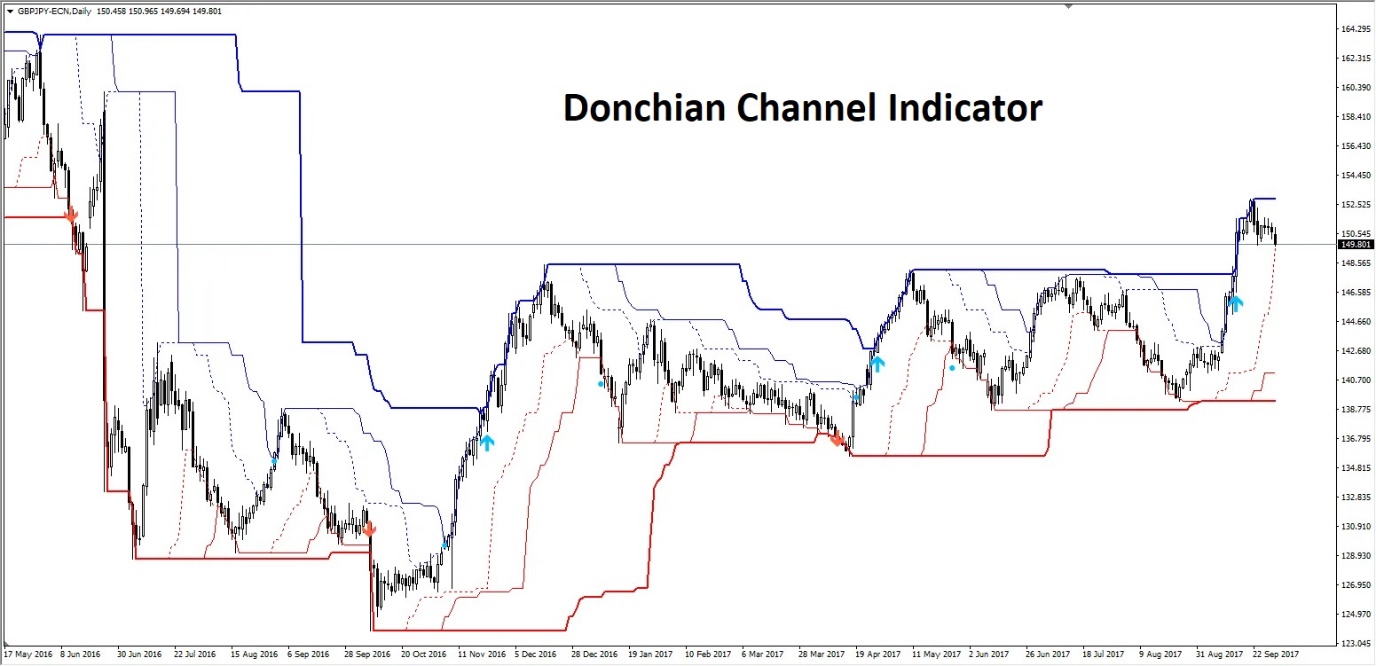
The Donchian Channel indicator is a powerful technical analysis tool that helps traders identify market trends and potential breakout opportunities. It works by plotting the highest high and lowest low over a specified period, creating a channel that visually highlights the price range in which an asset has been trading. This channel consists of three key components: the upper band, the lower band, and the midline (the average of the upper and lower bands).
What makes the Donchian Channel unique is its simplicity. Unlike more complex indicators, it focuses solely on price movement, allowing traders to identify key support and resistance levels with ease. For example, when the price breaks above the upper band, it indicates bullish momentum and signals a potential buy opportunity. Conversely, a break below the lower band suggests bearish momentum and may present a sell signal.
The Donchian Channel is especially useful in volatile markets like forex, where price trends often emerge following periods of consolidation. Traders can adjust the indicator’s time frame to suit their trading style. A common setting is the 20-period channel, popularized by trend-following strategies, but shorter or longer periods can be used for day trading or long-term investing.
The mechanics of the Donchian Breakout strategy
The Donchian Breakout Strategy is a straightforward and effective trading approach that leverages the concept of breakouts to identify potential market trends. It revolves around using the Donchian Channel indicator to pinpoint when the price of an asset breaks above the channel’s upper band or below its lower band, signaling the possibility of a new bullish or bearish trend. This strategy can be applied to a wide range of trading time frames, making it suitable for both short-term and long-term traders.
To implement the Donchian Breakout Strategy, traders typically follow these steps:
Set the time period
A commonly used setting is the 20-period Donchian Channel, which calculates the highest high and lowest low over the last 20 bars or candlesticks. Traders can adjust the time frame based on their trading preferences.
Identify breakouts
When the price moves above the upper band, it indicates a breakout to the upside and provides a potential buy signal. Similarly, when the price breaks below the lower band, it suggests a breakout to the downside and signals a potential sell opportunity.
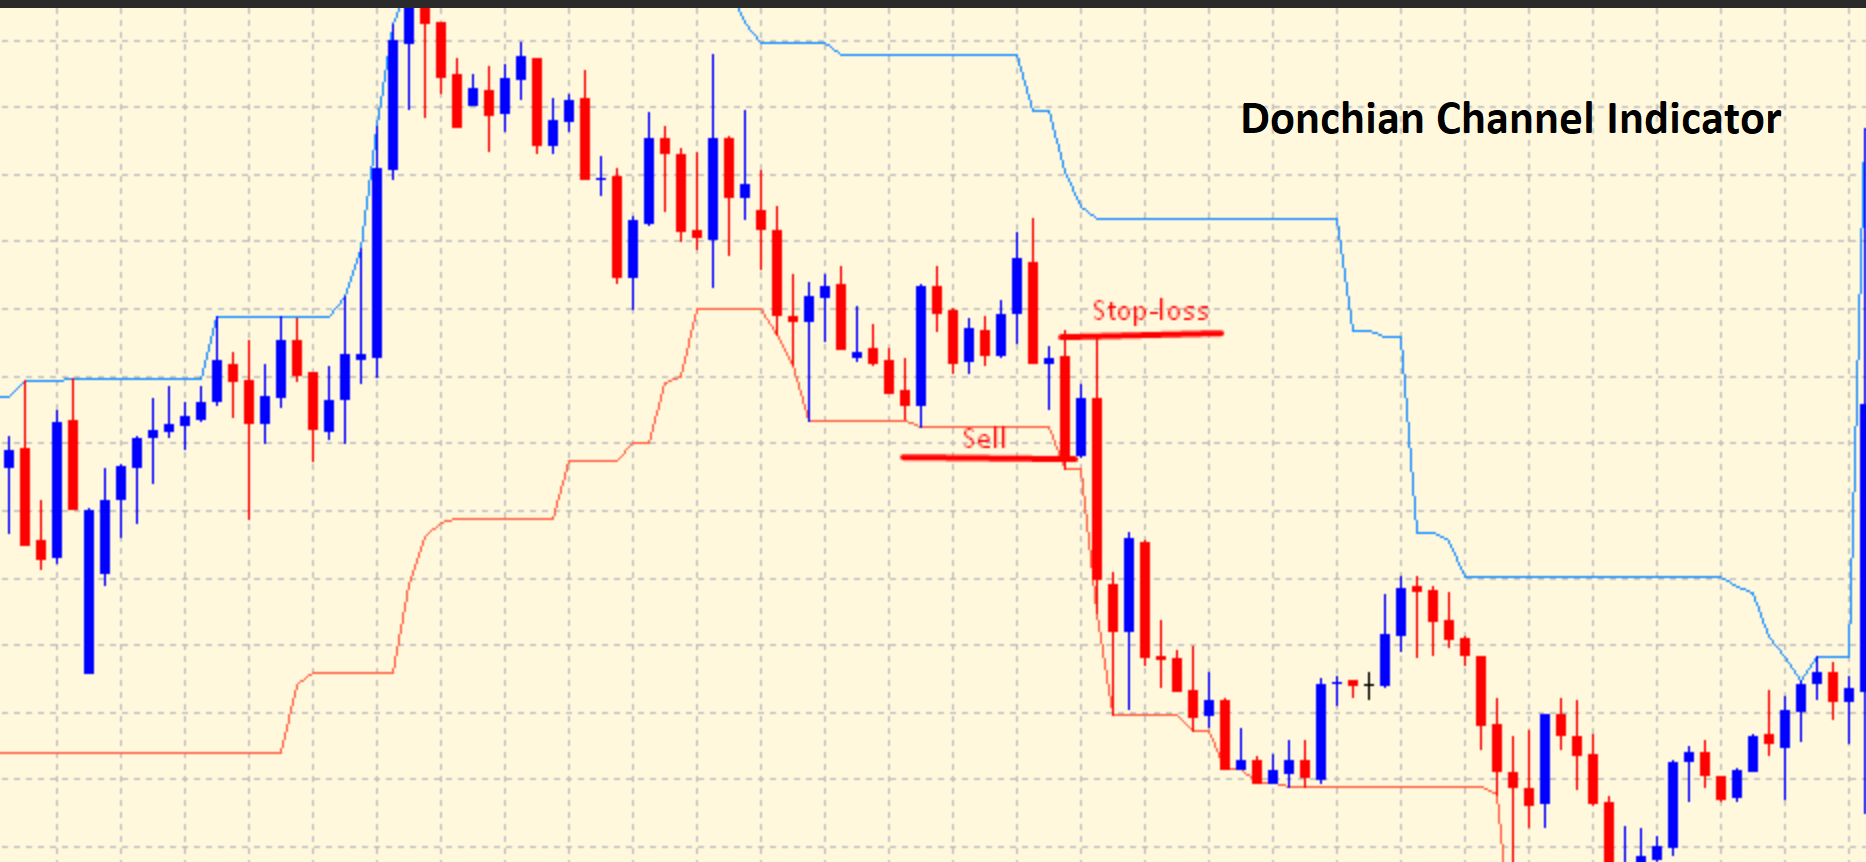
Place stop-loss orders
To manage risk, traders often place stop-loss orders just outside the opposite side of the channel. For example, in a bullish breakout, the stop-loss might be set slightly below the lower band.
Use trailing stops
As the price moves in the desired direction, trailing stops can be used to lock in profits while allowing the trade to continue benefiting from further price movement.
Advantages and limitations of the Donchian Channel breakout strategy
The Donchian Channel Breakout Strategy offers several advantages, making it a popular choice among forex traders. One of its key strengths lies in its simplicity. The indicator is easy to understand and implement, even for beginners, as it focuses on straightforward price action rather than complex calculations. By visually highlighting the highest high and lowest low within a specific period, the Donchian Channel helps traders identify breakout points with clarity.
Another advantage is its effectiveness in trending markets. The strategy enables traders to capture significant price movements by entering trades when the market exhibits clear directional momentum. This makes it ideal for forex trading, where currency pairs often experience strong trends. Additionally, the strategy can be customized to suit different trading styles, with adjustable time periods allowing traders to focus on short-term, medium-term, or long-term trends.
However, like any trading strategy, the Donchian Channel Breakout approach has its limitations. One major drawback is its vulnerability to false breakouts, which occur when the price temporarily moves outside the channel only to reverse back within it. These false signals can lead to losses if not managed properly. The strategy also performs poorly in ranging or sideways markets, where prices oscillate within a narrow range, generating frequent but unreliable signals.
To mitigate these limitations, traders often combine the Donchian Channel with other technical indicators, such as the Relative Strength Index (RSI) or moving averages, to confirm breakout signals. Risk management tools, like stop-loss orders and proper position sizing, are also essential for reducing potential losses and ensuring long-term success.
Tips for maximizing success with the Donchian Channel breakout strategy
While the Donchian Channel Breakout Strategy is a powerful tool for traders, its effectiveness depends on proper execution, risk management, and the use of complementary techniques. Below are key tips to help traders maximize their success with this strategy.
1. Combine with other indicators for confirmation
Breakouts can sometimes generate false signals, especially in choppy or ranging markets. To improve accuracy, traders often pair the Donchian Channel with additional technical indicators. For instance, the Relative Strength Index (RSI) can confirm the strength of a trend, while moving averages like the 50-day or 200-day SMA can help determine the broader trend direction. Similarly, the Average True Range (ATR) is useful for assessing market volatility and setting dynamic stop-loss levels.
2. Adjust time frames to suit trading style
Traders should customize the Donchian Channel period based on their preferred trading time frame. Shorter periods (e.g., 10-period channels) are ideal for day traders seeking quick signals, while longer periods (e.g., 50-period channels) are better suited for swing or position traders looking to capture larger trends. Testing different time frames on a demo account can help traders find what works best for their strategy.
3. Implement proper risk management
Risk management is crucial when using the Donchian Channel Breakout Strategy. Traders should limit their risk per trade to a small percentage of their account balance—commonly 1-2%. Additionally, placing stop-loss orders just beyond the channel’s opposite band can help protect against sudden price reversals.
4. Understand market conditions
The Donchian Channel Breakout Strategy works best in trending markets. Therefore, it’s important to evaluate market conditions and avoid applying this strategy during low-volatility or range-bound periods. Being selective with trade entries can improve success rates significantly.
Case studies
The Donchian Channel Breakout Strategy has been successfully applied in various market conditions. Below are real-world examples and insights based on historical market data:
1. EUR/USD trends during the 2020 Pandemic volatility
During the initial wave of the COVID-19 pandemic in March 2020, the forex market experienced heightened volatility. The EUR/USD pair broke above the 20-period Donchian Channel's upper band, signaling a bullish breakout. Traders who entered the market following this signal could have capitalized on the pair’s sustained upward trend as central banks introduced aggressive monetary easing measures. According to Bloomberg data, the EUR/USD rallied from approximately 1.07 in March 2020 to over 1.20 by the end of the year. The Donchian Channel effectively captured this long-term trend, especially when combined with trailing stop-losses to lock in profits.
2. USD/JPY ranging markets in 2018
In 2018, the USD/JPY pair entered a prolonged period of sideways trading between the 108 and 114 levels. Traders relying on the Donchian Channel Breakout Strategy encountered false breakouts, as the price frequently moved beyond the upper or lower bands before reversing back into the channel. Historical data from Investing.com shows how traders who combined the Donchian Channel with an oscillator, such as the RSI, were better able to identify overbought and oversold conditions, reducing the impact of false signals during this choppy market.
3. GBP/USD breakouts around Brexit announcements in 2016
The Brexit referendum in June 2016 caused massive volatility in the forex market. The GBP/USD pair saw sharp breakouts on both sides of the 20-period Donchian Channel as traders reacted to uncertainty around the UK’s future in the European Union. During this time, the Donchian Channel Breakout Strategy worked well when used in combination with volatility indicators like the Average True Range (ATR). Data from the Bank of England and Reuters reveals that traders using these tools profited from significant downward moves, such as the GBP/USD dropping from 1.50 pre-referendum to 1.32 shortly after the results were announced.
Conclusion
The Donchian Channel Breakout Strategy remains a valuable tool for traders seeking to capitalize on market trends in forex and other financial markets. Rooted in the concept of price breakouts and built on the simplicity of the Donchian Channel indicator, this strategy provides a structured approach for identifying potential entry and exit points based on price action. By focusing on price highs and lows over a specified period, the strategy helps traders visualize key support and resistance levels, offering clarity even in volatile market conditions.
One of the most significant advantages of the Donchian Breakout Strategy is its versatility. It can be applied to various time frames, making it suitable for day traders, swing traders, and long-term investors alike. However, traders must recognize that no strategy is foolproof. While the Donchian Channel excels in trending markets, it can be less reliable in ranging or low-volatility environments, where false breakouts are common.
To overcome these challenges, traders should consider combining the Donchian Channel with complementary indicators, such as RSI or ATR, to confirm breakouts and improve reliability. Additionally, employing proper risk management—through position sizing, stop-loss orders, and trailing stops—is crucial to safeguard against sudden market reversals.