Daily chart forex strategy
While the forex market presents vast prospects, it is important to recognize that success in trading goes beyond mere chance or luck. Seasoned traders understand the critical role of implementing effective trading strategies to navigate the complexities of the market. A well-thought-out and disciplined approach can provide a competitive edge, helping traders make informed decisions and manage risks efficiently.
Daily chart trading strategies have gained popularity and recognition among traders among the various trading methodologies. The daily chart, also known as the timeframe of one trading day, offers a comprehensive view of price movements, trends, and market dynamics. Daily chart strategies focus on identifying high-probability trades based on analysing price action, key levels, and trends that unfold over a more extended period.
Understanding daily chart forex trading
Daily charts in forex trading provide a comprehensive and holistic view of price movements and market trends over a trading day. Each candlestick or bar on the daily chart represents a full day's worth of trading activity, encapsulating the opening, closing, high and low prices. This timeframe allows traders to observe the overall market sentiment and make informed decisions based on the bigger picture. Daily charts offer several advantages, including reduced noise and increased clarity compared to shorter timeframes like intraday charts. They provide a balanced perspective on price action, enabling traders to identify meaningful patterns, key support and resistance levels, and long-term trends.
Successful daily chart trading requires a systematic approach and a deep understanding of key elements that drive profitability. Firstly, traders must master the art of identifying high-probability trade setups based on technical indicators, chart patterns, and price action signals. Patience and discipline are crucial virtues in daily chart trading, as it involves waiting for the optimal trade entry points aligned with the established trading plan.
A historical analysis of daily chart strategies reveals their enduring effectiveness in capturing substantial market moves and generating consistent profits. Throughout the evolution of the forex market, daily chart trading strategies have stood the test of time. The longer timeframe reduces the impact of market noise, false signals, and short-term fluctuations, enabling traders to focus on reliable patterns and trends. Historical data showcases how well-executed daily chart strategies have produced notable results, outperforming shorter-term trading approaches. With a more extended time horizon, daily chart traders can better ride out market volatility and capture substantial price moves that span multiple days or weeks.
Developing a forex daily chart trading system
When developing a forex daily chart trading system, selecting currency pairs that align well with the characteristics of daily charts is essential. Major currency pairs like EUR/USD, GBP/USD, and USD/JPY are popular due to their high liquidity and tight spreads. These pairs tend to exhibit reliable trends and well-defined support and resistance levels daily. Additionally, traders should consider currency pairs with sufficient volatility to provide trading opportunities without excessive risk.
To set up the daily chart, traders can utilize popular charting platforms that offer customizable settings and a wide range of technical indicators. Analyzing price action on the daily chart involves studying candlestick patterns, trend lines, moving averages, and other relevant indicators. Traders should look for clear patterns, breakouts, and confluence of signals that suggest potential trade setups. Daily charts provide a comprehensive view of market sentiment, helping traders gauge a currency pair's overall direction and strength.
Determining optimal entry and exit points is crucial in daily chart trading. Traders often rely on price levels, such as support and resistance, to identify trade entry points. Breakouts above resistance or below support can provide strong signals for trade entry. Additionally, traders may use price patterns like triangles, flags, or double tops/bottoms to anticipate trend continuations or reversals. Stop-loss orders should be placed strategically below support or above resistance to limit potential losses. Profits can be taken based on predetermined targets or by trailing stop-loss orders to capture extended price movements.

Exploring popular daily chart trading strategies
Support and resistance levels are key components of daily chart trading strategies. These levels represent horizontal price zones where the market has historically shown a tendency to reverse or stall. Traders can identify support levels as areas where buying pressure has historically exceeded selling pressure, causing prices to bounce higher. Conversely, resistance levels indicate areas where selling pressure has historically surpassed buying pressure, leading to price reversals. By analyzing historical price action and identifying these critical levels, traders can make informed trading decisions. Daily chart traders often use support and resistance levels as a basis for entering trades, setting profit targets, and placing stop-loss orders.
Trend following is a widely employed strategy in daily chart trading. It involves identifying and trading in the direction of established trends in the market. Traders who utilize this approach aim to capture substantial price movements that occur as trends unfold. Daily charts provide a reliable view of long-term trends, allowing traders to identify higher probability trade setups. Trend following strategies often utilize moving averages, trend lines, or other trend indicators to confirm the direction and strength of the trend. By entering trades in alignment with the dominant trend, traders increase the likelihood of profitable outcomes.
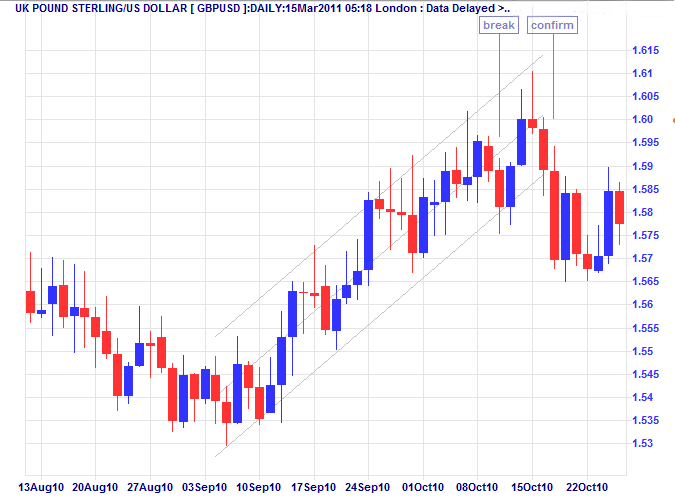
Breakout trading is a strategy that capitalizes on price volatility and significant price movements occurring after a period of consolidation. Daily charts offer an ideal timeframe to identify and trade breakouts. Traders look for chart patterns, such as triangles, rectangles, or flags, which indicate a period of price consolidation. When the price breaks out of these patterns with strong momentum, it often signifies the start of a new trend or a continuation of the existing one. Daily chart traders who employ breakout strategies carefully monitor key support and resistance levels and seek confirmation through volume or other technical indicators before entering trades.
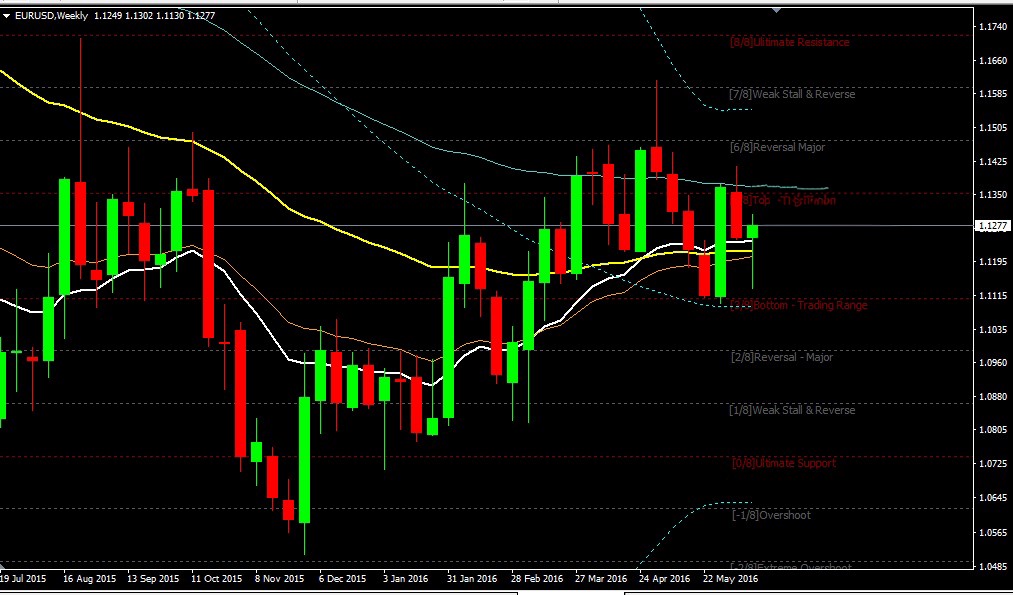
Daily chart traders can enhance their trading decisions by incorporating multiple time frame analysis. This approach examines price action and trends across different timeframes, such as weekly, daily, and intraday charts. By observing higher timeframes, traders can identify the broader market context, major trends, and key support and resistance levels. This macro perspective helps daily chart traders align their trades with the overall market direction, increasing the probability of successful outcomes. Multiple time frame analysis provides a more comprehensive view of the market and helps traders make more informed trading decisions.

Backtesting and optimization
Backtesting is a crucial step in developing and validating any trading strategy, including daily chart strategies. It involves applying the strategy to historical market data to assess its performance and potential profitability. By backtesting a strategy, traders can evaluate its effectiveness, identify strengths and weaknesses, and gain confidence in its ability to generate consistent results. Backtesting provides valuable insights into the strategy's historical performance, including win rate, average profit, and drawdowns. It helps traders assess whether the strategy aligns with their risk tolerance and trading objectives before committing real capital.
Utilizing historical data is vital in evaluating and refining daily chart trading strategies. Traders can analyze past price patterns, market conditions, and outcomes to identify patterns, trends, and correlations. By studying historical data, traders understand the strategy's performance under various market conditions. They can identify potential adjustments or modifications to improve the strategy's robustness and adaptability. Historical data analysis enables traders to refine entry and exit rules, optimize risk management techniques, and enhance the overall profitability of their daily chart trading strategy.
Optimization techniques play a significant role in maximizing the profitability of daily chart trading strategies. Traders can employ various optimization methods to fine-tune the strategy's parameters and improve its performance. These methods include adjusting moving average periods, optimizing profit targets and stop-loss levels, and testing different combinations of indicators. Optimization involves striking a balance between complexity and simplicity, ensuring that the strategy remains effective without becoming overly complicated. It is crucial to conduct optimization with prudence and avoid overfitting the strategy to historical data. By carefully optimizing the strategy, traders can enhance its profitability and adaptability to changing market conditions.
Risk management and psychology in daily chart trading
In daily chart trading, risk management is paramount to long-term success and preservation of capital. It involves assessing and mitigating potential risks associated with each trade. Traders must determine an appropriate risk-reward ratio for every trade, ensuring that potential profits outweigh potential losses. By managing risk effectively, traders can protect themselves from significant drawdowns and maintain a stable trading account. Implementing proper risk management techniques, such as position sizing, setting stop-loss orders, and using trailing stops, is crucial for daily chart traders to navigate the dynamic nature of the forex market.
Daily chart trading can pose psychological challenges for traders. The longer timeframe requires patience and discipline, as trades may take days or weeks to unfold. Traders must overcome the temptation to micromanage trades or make impulsive decisions based on short-term market fluctuations. Additionally, dealing with losing trades and managing emotions like fear and greed can be demanding. Traders need to develop a robust mindset and maintain confidence in their trading strategy, even during periods of temporary setbacks. By acknowledging and addressing psychological challenges, daily chart traders can stay focused, make rational decisions, and maintain a consistent approach to trading.
Tools and resources for daily chart trading
Charting platforms and indicators are essential tools for daily chart trading. These platforms provide traders access to real-time and historical price data, allowing them to analyze charts and make informed trading decisions. Popular charting platforms such as MetaTrader, TradingView, and NinjaTrader offer a wide range of features, including customizable chart settings, technical indicators, and drawing tools. Traders can utilize indicators like moving averages, oscillators, and trend lines to identify patterns, confirm trends, and generate trading signals. Choosing charting platforms and indicators that align with individual trading preferences and strategies is important.
Trading journals and performance tracking tools are invaluable for daily chart traders. Maintaining a trading journal allows traders to record and analyze their trades systematically. It comprehensively records entry and exit points, trade rationale, and performance metrics. By reviewing past trades, traders can identify patterns, strengths, and weaknesses in their trading strategy. Performance tracking tools offer automated tracking and analysis of trading results, providing insights into key performance indicators such as win rate, average profit, and risk-reward ratio. These tools help traders evaluate their progress, make data-driven decisions, and continuously improve their trading performance.
Conclusion
Successful daily chart trading requires a combination of technical analysis skills, risk management discipline, and psychological resilience. By emphasizing the significance of risk management and addressing psychological challenges, traders can navigate the inherent uncertainties of the market and maintain a consistent approach to trading. Utilizing tools such as charting platforms, indicators, online resources, and trading journals further enhances the trader's ability to make informed decisio


