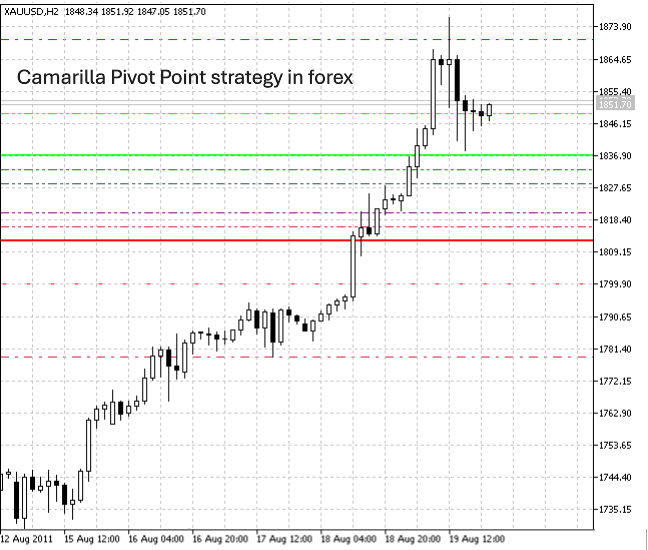
Camarilla Pivot Point strategy in forex
Pivot points, in general, are widely used in technical analysis to identify potential support and resistance levels, helping traders make informed decisions about entry and exit points. Among the various pivot point strategies, the Camarilla method stands out for its precision and adaptability to dynamic market conditions.
What makes the Camarilla strategy particularly valuable is its dual application. It can be used to trade within a range when the market is consolidating, or to identify breakouts during periods of strong trends. Developed in the late 1980s, this strategy focuses on eight key levels, including four support (S1–S4) and four resistance (R1–R4) levels, derived from the previous day's high, low, and closing prices. These levels provide traders with a structured framework to predict market movements with greater accuracy.
What are Pivot Points in forex trading?
Pivot points provide traders with a reliable framework for identifying potential support and resistance levels. These levels are derived from the previous day’s price action, including the high, low, and closing prices, and are used to anticipate where price reversals, breakouts, or consolidations may occur during the trading session. Pivot points help traders gauge market sentiment and make informed decisions about when to enter or exit trades.
The concept of pivot points originated in the stock market but has since been widely adopted by forex traders due to their effectiveness in identifying key price zones. Essentially, pivot points act as a “compass” for market direction. When the price is trading above the main pivot point, it is often interpreted as bullish, whereas trading below it suggests bearish sentiment.
There are several types of pivot point strategies that traders use, including Standard Pivot Points, Fibonacci Pivot Points, Woodie’s Pivot Points, and the Camarilla Pivot Points. While each method has its unique calculations and applications, they all share a common goal: to provide a predictive edge in identifying levels of market equilibrium.
The Camarilla Pivot Point Strategy, in particular, stands out because of its emphasis on a more granular set of support and resistance levels. With eight distinct levels (S1–S4 and R1–R4), this method is especially favored by intraday traders looking to capitalize on short-term price movements with higher precision.
Key concepts of the Camarilla Pivot Point strategy
The Camarilla Pivot Point Strategy is a unique technical analysis method that helps forex traders identify critical price levels for potential reversals or breakouts. This strategy was introduced in the late 1980s by Nick Scott, who designed it to provide more precise trading signals based on the natural tendencies of price action to revert to the mean. Unlike traditional pivot point strategies, the Camarilla method focuses on eight levels: four support levels (S1–S4) and four resistance levels (R1–R4), which are calculated using the previous day’s high, low, and closing prices.
The core principle of the Camarilla strategy is market reversion. It operates on the assumption that prices tend to gravitate back to their average or equilibrium level after significant movements. For this reason, S3 and R3 are often viewed as the most critical levels, as they indicate potential reversal zones where traders can look for buying or selling opportunities within a range-bound market. Conversely, S4 and R4 levels signal points of extreme price movement, which may indicate a breakout if the price closes decisively beyond these levels.
This dual approach—trading within a range or capitalizing on breakouts—makes the Camarilla Pivot Point Strategy particularly versatile. Intraday traders and scalpers favor it due to its precision in volatile market conditions. Additionally, the strategy’s adaptability to multiple timeframes and currency pairs allows traders to tailor it to their specific trading styles, making it a valuable tool for navigating the complexities of the forex market.
How to calculate Camarilla Pivot Points
Calculating Camarilla Pivot Points is straightforward and relies on using the previous day’s market data—specifically the high (H), low (L), and closing (C) prices. These calculations result in eight key levels: four support levels (S1–S4) and four resistance levels (R1–R4), which provide traders with actionable insights into potential price movements. The formula for Camarilla pivot points is as follows:
- R1 = C + (H - L) × 1.1 ÷ 12
- R2 = C + (H - L) × 1.1 ÷ 6
- R3 = C + (H - L) × 1.1 ÷ 4
- R4 = C + (H - L) × 1.1 ÷ 2
- S1 = C - (H - L) × 1.1 ÷ 12
- S2 = C - (H - L) × 1.1 ÷ 6
- S3 = C - (H - L) × 1.1 ÷ 4
- S4 = C - (H - L) × 1.1 ÷ 2
The key levels (S3, S4, R3, and R4) are the most significant in this strategy. S3 and R3 are considered ideal points for reversal trades, while S4 and R4 are used to identify potential breakout trades. These calculations are designed to provide actionable insights for intraday trading, making them particularly useful for traders looking to capitalize on short-term price movements.
While manual calculations are possible, many traders rely on automated tools such as trading platforms (e.g., MetaTrader 4/5 or TradingView) or online calculators to generate Camarilla pivot levels quickly and accurately.
How to use the Camarilla Pivot Point strategy in forex trading
The Camarilla Pivot Point Strategy offers a versatile framework for trading, whether you prefer range-bound or breakout trading approaches. By leveraging the eight pivot levels (S1–S4 and R1–R4), traders can identify key price zones for potential market reversals or momentum-driven breakouts. Here's how to apply this strategy effectively:
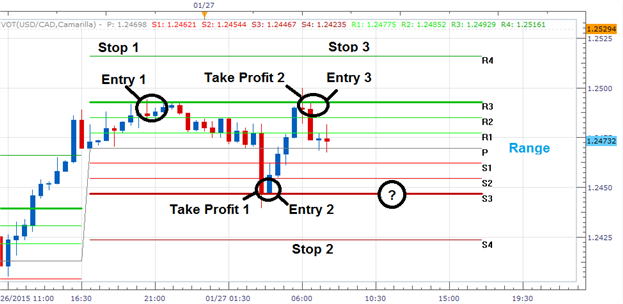
1. Trading within the range (Reversal strategy)
One of the most popular uses of the Camarilla strategy is trading reversals within the range defined by S3 and R3. When the price approaches these levels, it often signals exhaustion of the current trend and the potential for a reversal. For example:
- If the price approaches S3 and shows signs of bouncing upward (e.g., bullish candlestick patterns), traders can consider entering a long position with a target near the pivot point or R3.
- Conversely, if the price reaches R3 and begins to reverse downward, traders might take a short position aiming for the pivot point or S3.
This range-bound approach is especially useful during low-volatility or consolidating markets.
2. Breakout trading (Momentum strategy)
When price breaks through S4 or R4 with strong momentum, it may indicate the start of a breakout. In this case:
- A break below S4 suggests bearish momentum, prompting traders to consider short positions.
- A break above R4 signals bullish momentum, making it a potential entry for long positions.
To manage risk, traders should set stop-loss orders just above or below the breakout levels and use take-profit orders based on their risk-reward ratio.
Combining the Camarilla Pivot Point Strategy with additional indicators, such as RSI or MACD, can help confirm trade setups and filter out false signals, ultimately improving trading accuracy.
Tips for mastering the Camarilla Pivot Point strategy
While the strategy provides clear support and resistance levels, its effectiveness largely depends on how traders implement it.
Use a demo account for practice
Before applying the strategy in live markets, traders should test it extensively on a demo account. This allows them to familiarize themselves with identifying reversal and breakout opportunities at the S3, S4, R3, and R4 levels without risking real money. It also provides a safe space to refine entry, exit, and stop-loss techniques.
Combine with other indicators
To improve accuracy and filter out false signals, pair Camarilla pivot points with complementary indicators. For example, use the Relative Strength Index (RSI) to confirm overbought or oversold conditions near S3 or R3. Alternatively, tools like Moving Average Convergence Divergence (MACD) can confirm momentum during breakouts at S4 or R4.
Monitor economic events
Economic news releases, such as central bank announcements, GDP data, or employment reports, can cause unexpected market volatility. Using an economic calendar helps traders avoid entering trades during high-impact events or adapt their strategy accordingly.
Refine entries and exits with price action
Study candlestick patterns, such as pin bars or engulfing candles, to validate reversal or breakout signals near critical levels. This approach enhances precision in timing trades.
Analyze performance
Consistently review past trades to identify patterns of success and areas for improvement. Journaling trades based on the Camarilla Pivot Point Strategy can help traders fine-tune their approach over time.
Conclusion
The Camarilla Pivot Point Strategy is a valuable tool in the arsenal of forex traders, providing a structured framework to analyze price levels and identify trading opportunities. By focusing on eight distinct levels—four support (S1–S4) and four resistance (R1–R4)—this strategy allows traders to anticipate potential reversals and breakouts with remarkable precision.
A key advantage of the strategy is its clarity in identifying critical price zones. Traders can rely on levels like S3 and R3 to trade within a range, capitalizing on reversals, or use S4 and R4 to spot breakout opportunities driven by momentum. Additionally, the predefined levels help set clear stop-loss and take-profit points, which are essential for effective risk management.
However, the Camarilla Pivot Point Strategy is not without challenges. Traders must be mindful of market volatility, false breakouts, and the limitations of relying solely on historical price data. To maximize its effectiveness, combining it with other tools such as RSI, MACD, or candlestick patterns is essential.