Bollinger band breakout strategy
Bollinger Bands have emerged as a prominent technical analysis tool in the world of forex trading, offering traders valuable insights into market dynamics and potential trading opportunities. Developed by renowned trader John Bollinger, these bands provide a visual representation of price volatility and help traders identify crucial price levels for making informed trading decisions.
In the fast-paced and ever-changing forex market, traders are constantly seeking strategies that offer an edge. This is where the Bollinger Band breakout strategy proves its worth. By capitalizing on price breakouts beyond the established bands, this strategy enables traders to potentially profit from significant price movements and capture valuable trading opportunities.
Understanding Bollinger bands
Bollinger Bands consist of three components that provide valuable insights into price volatility and potential trading opportunities. The first component is the middle band, which is a simple moving average (SMA) that represents the average price over a specified period. The upper band and lower band are positioned at a certain number of standard deviations above and below the middle band, respectively. These bands dynamically expand and contract as market volatility fluctuates.
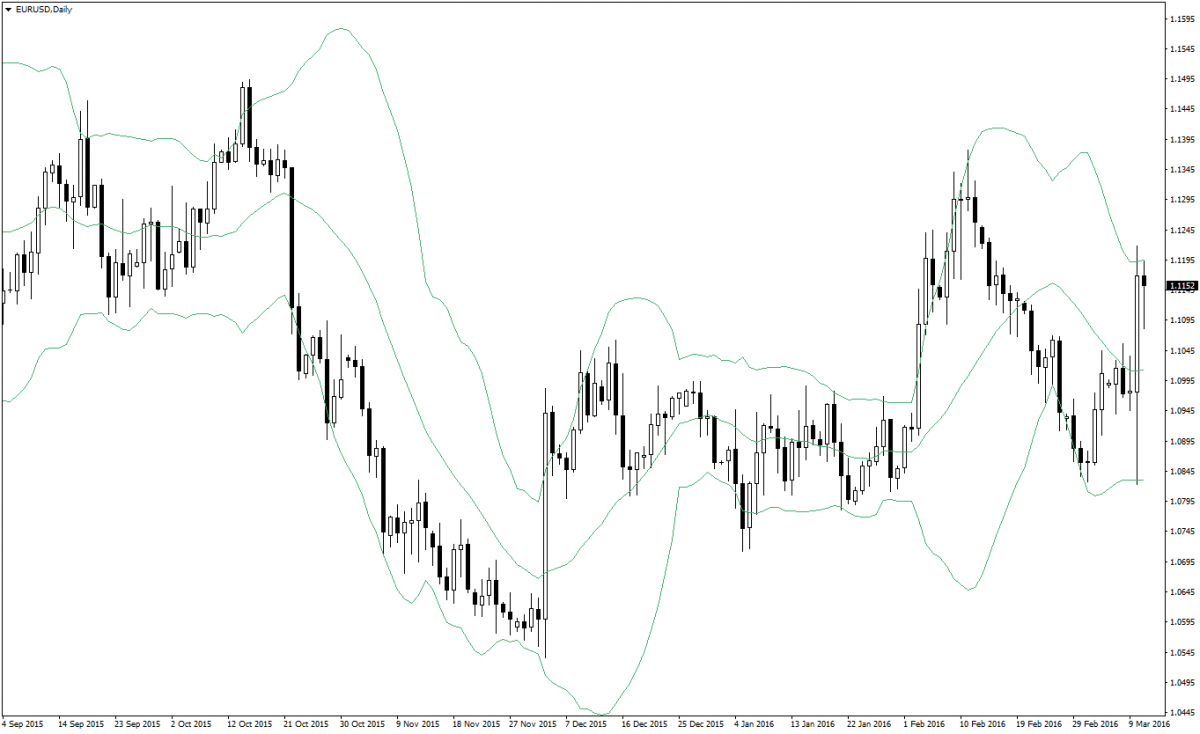
Bollinger Bands serve as a powerful tool for volatility analysis. When the market is highly volatile, the bands widen, reflecting greater price fluctuations. Conversely, during periods of low volatility, the bands narrow, indicating reduced price movement. Traders can use this information to gauge the market's current state and adjust their trading strategies accordingly.
Standard deviation plays a crucial role in the calculation of Bollinger Bands. It measures the dispersion of price data from the middle band. A larger standard deviation indicates higher volatility, resulting in wider bands, while a smaller standard deviation corresponds to lower volatility, leading to narrower bands. By understanding standard deviation, traders can assess the market's price range and identify potential breakouts or reversals.
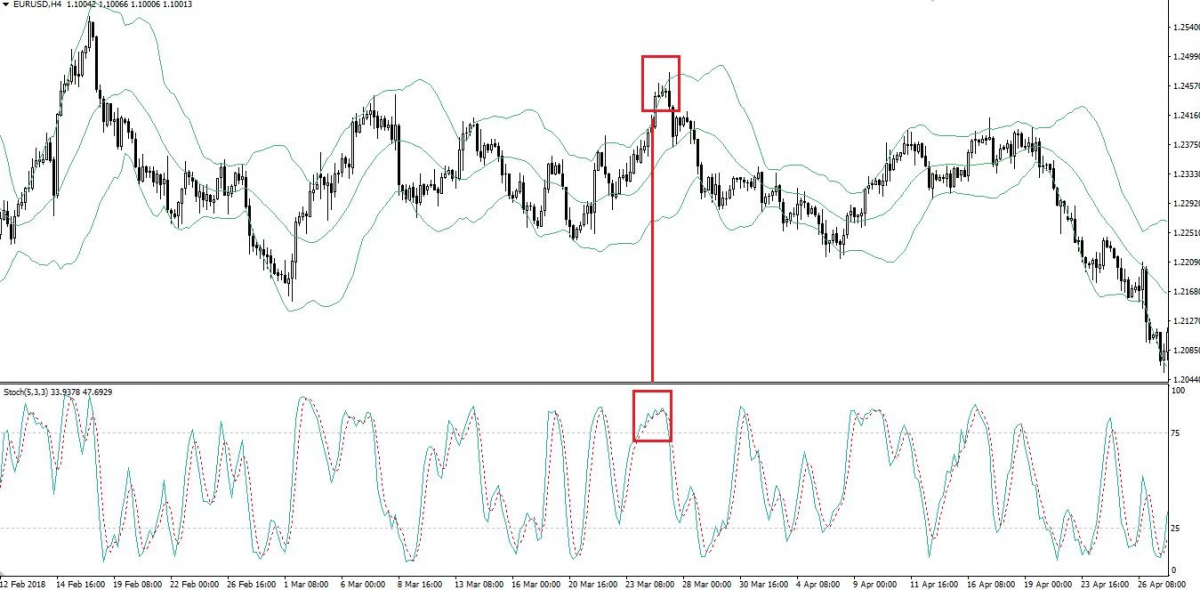
Bollinger Bands are visually represented on price charts, allowing traders to observe price movements relative to the bands. When prices touch or penetrate the upper band, it signals potential overbought conditions, indicating a possible reversal or correction. Conversely, prices reaching or falling below the lower band suggest potential oversold conditions, signaling a potential price reversal to the upside.
Understanding the components and interpretation of Bollinger Bands is essential for traders seeking to harness the power of the Bollinger Band breakout strategy. By analyzing the dynamic relationship between price, volatility, and the bands, traders can make informed trading decisions and capitalize on potential breakout opportunities.
The Bollinger band breakout strategy
The Bollinger Band breakout strategy revolves around identifying key moments when price breaks out of the established Bollinger Bands, signaling potential trading opportunities. When the price breaches the upper band, it suggests a bullish breakout, indicating the possibility of an upward price surge. Conversely, when the price falls below the lower band, it indicates a bearish breakout, implying a potential downward price movement. Traders can capitalize on these breakouts by entering positions in the direction of the breakout.
To identify breakout signals using Bollinger Bands, traders closely monitor price action in relation to the bands. Breakouts are typically confirmed when the price closes outside the bands. For example, a strong bullish breakout occurs when the price closes above the upper band, while a robust bearish breakout is confirmed by a close below the lower band. Traders may also consider other technical indicators or patterns to validate breakout signals and increase the probability of successful trades.

Differentiating between range-bound markets and breakout opportunities
One of the challenges in implementing the Bollinger Band breakout strategy is distinguishing between range-bound markets and genuine breakout opportunities. Range-bound markets exhibit prices that oscillate within the confines of the bands, indicating a lack of directional momentum. Traders must exercise caution and avoid trading breakouts in such conditions. By analyzing the overall market trend and observing volume patterns, traders can discern whether the market is in a range-bound phase or primed for a breakout.
Successful implementation of the Bollinger Band breakout strategy requires considering several key factors. Firstly, traders should select appropriate settings for the Bollinger Bands, including the period and standard deviation values, to suit the specific currency pair and timeframe. Additionally, traders must apply proper risk management techniques, including setting stop-loss orders and determining favourable risk-to-reward ratios. Finally, traders should combine the Bollinger Band breakout strategy with other technical analysis tools and fundamental analysis to gain a comprehensive understanding of the market and validate breakout signals.
Benefits and limitations of Bollinger band scalping
Advantages of Bollinger band scalping in forex trading
Bollinger band scalping offers several advantages for forex traders seeking short-term trading opportunities. Firstly, this strategy allows traders to take advantage of quick price movements within the bands, potentially generating frequent trading opportunities. Scalpers aim to profit from small price fluctuations, and Bollinger Bands provide valuable guidance in identifying these short-term trends. Moreover, Bollinger band scalping can be applied to various currency pairs and timeframes, offering flexibility to adapt to market conditions.
Potential challenges and limitations of the strategy
Despite its benefits, Bollinger band scalping does present some challenges. One of the main limitations is the potential for false breakouts or whipsaws, where prices briefly move beyond the bands but quickly reverse. Traders need to exercise caution and implement additional confirmation indicators to reduce the risk of false signals. Additionally, scalping requires quick decision-making and execution, which can be demanding for traders who struggle with time management or emotional discipline.
Risk management considerations for successful implementation
Implementing proper risk management is crucial when utilizing the Bollinger band scalping strategy. Traders should define clear entry and exit points, set appropriate stop-loss orders, and determine realistic profit targets. It is essential to maintain discipline and adhere to risk-reward ratios to ensure consistent profitability. Additionally, traders should consider the impact of transaction costs, such as spreads and commissions, as frequent trading can accumulate fees.
Practical guidelines for implementing the Bollinger band breakout strategy
To effectively implement the Bollinger Band breakout strategy, traders should determine the optimal settings for the Bollinger Bands based on the specific currency pair and timeframe. A shorter period, such as 20 or 30, may provide more responsive signals, while a longer period, like 50 or 100, could filter out noise and offer more reliable breakouts. Traders should experiment with different settings and backtest their strategies to find the most suitable configuration.
Entry and exit points for trades based on Bollinger band breakouts
When implementing the Bollinger Band breakout strategy, traders should establish clear entry and exit points. For a bullish breakout, an entry point could be when the price closes above the upper band, accompanied by confirming indicators like increased volume or bullish candlestick patterns. Conversely, for a bearish breakout, an entry point may be when the price closes below the lower band, supported by additional technical signals. Traders should also determine appropriate exit points, such as profit targets or trailing stop-loss orders.
Incorporating additional technical indicators to confirm breakout signals
While Bollinger Bands provide valuable insights into price volatility and breakouts, incorporating additional technical indicators can enhance the accuracy of signals. Traders may consider using oscillators like the Relative Strength Index (RSI) or the Stochastic Oscillator to identify overbought or oversold conditions. Chart patterns, such as triangles or flags, can also complement Bollinger Band breakouts. By combining multiple indicators, traders can strengthen the validity of breakout signals and increase their confidence in trade execution.

Fine-tuning the Bollinger band scalping strategy
The Bollinger Band scalping strategy can be fine-tuned by adapting it to different timeframes and currency pairs. Shorter timeframes, such as the 1-minute or 5-minute charts, offer more frequent trading opportunities but require swift decision-making and execution. On the other hand, longer timeframes, like the 15-minute or 1-hour charts, may provide more reliable signals but with fewer opportunities. Traders should consider their preferred trading style, availability, and the characteristics of the currency pairs they are trading to determine the most suitable timeframe.
Traders can further refine the Bollinger Band scalping strategy by adjusting the settings of the Bollinger Bands. Increasing the number of standard deviations, for example, from 2 to 3, can result in wider bands, providing increased sensitivity to price movements. This adjustment may generate more signals but may also include a higher number of false breakouts. Conversely, decreasing the number of standard deviations can narrow the bands, offering greater specificity but potentially reducing the number of trading opportunities. Traders should experiment with different settings and evaluate the impact on their trading results.
Considering market conditions and overall trends when using the strategy
When implementing the Bollinger Band scalping strategy, it is crucial to consider market conditions and the overall trend. In trending markets, where prices exhibit a clear upward or downward movement, traders may focus on trading in the direction of the trend, aiming for breakouts that align with the prevailing momentum. In range-bound markets, where prices consolidate within a specific range, traders may look for breakouts from support or resistance levels. Understanding the market context and aligning the strategy with the prevailing conditions can increase the effectiveness of Bollinger Band scalping.
By fine-tuning the Bollinger Band scalping strategy through adapting it to different timeframes and currency pairs, adjusting Bollinger Band settings, and considering market conditions and trends, traders can enhance the performance and profitability of their scalping endeavors. Flexibility, continuous evaluation, and adaptation are key to maximizing the potential of this strategy in the dynamic forex market.
Conclusion
In conclusion, the Bollinger Band breakout strategy is a powerful tool for forex traders to identify potential trading opportunities. By using the upper and lower bands as dynamic support and resistance levels, traders can identify breakouts and capitalize on price movements. The strategy allows traders to take advantage of periods of increased volatility and profit from significant price shifts.
While the Bollinger Band breakout strategy offers significant potential for profits, it is important to emphasize the crucial role of proper risk management in forex trading. Traders must implement appropriate position sizing, set stop-loss orders to limit potential losses, and consider the risk-reward ratio of each trade. By effectively managing risk, traders can safeguard their capital and ensure longevity in the markets.
Every trader is unique, and it is essential to encourage individuals to experiment with the Bollinger Band breakout strategy and adapt it to their individual trading styles. Traders can explore different timeframes, adjust the settings of the Bollinger Bands, and incorporate additional indicators to fine-tune the strategy according to their preferences and risk tolerance. Through continuous learning, practice, and adaptation, traders can optimize the strategy's performance and achieve their trading objectives.
In conclusion, the Bollinger Band breakout strategy provides traders with a systematic approach to identify potential breakout opportunities in the forex market. By harnessing the power of Bollinger Bands and combining it with effective risk management, traders can increase their chances of success. With proper experimentation and adaptation, traders can personalize the strategy to align with their unique trading styles and preferences.


